This article has been reviewed according to Science X's editorial process and policies. Editors have highlighted the following attributes while ensuring the content's credibility:
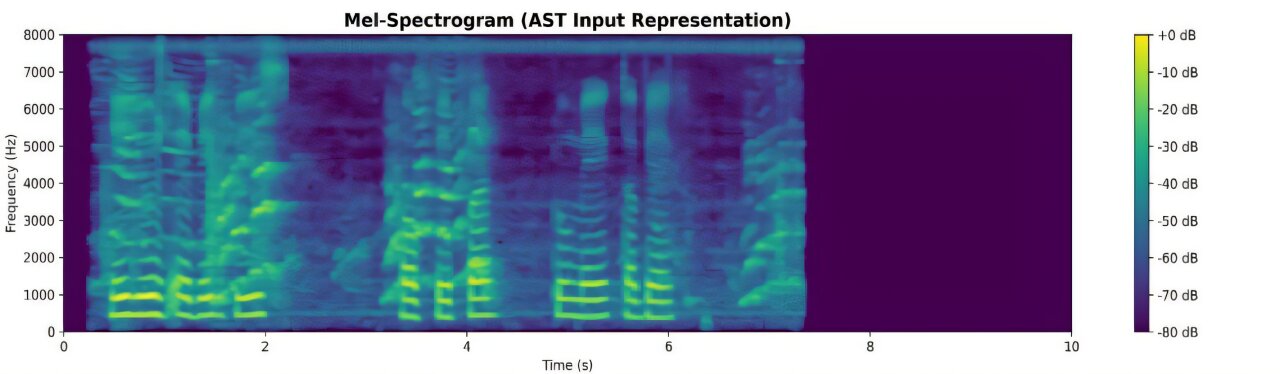
A new study in the IEEE Journal of Biomedical and Health Informatics reveals how scientists at Klick Labs created visual maps of sound frequencies (spectrograms) to identify complex, new patterns associated with type 2 diabetes, using only smartphone recordings of randomly selected short English sentences and participant sex as study criteria.
The scientists analyzed 14,759 voice recordings from 461 adults, which were converted into visual spectrograms before being analyzed by an Audio Spectrogram Transformer. The process allows the model to learn complex combinations of acoustic patterns directly from the recordings rather than relying primarily on predefined voice features selected in advance. Using voice only, the sex-stratified models achieved a balanced accuracy of 71.3% for women and 72.4% for men, with area under the receiver operating characteristic curve (AUC) values of 0.788 (78.8%) and 0.779 (77.9%), respectively.
"Now, we can literally see many more clues related to diabetes within vocal biomarkers," said Yan Fossat, senior vice president, digital health R&D at Klick Applied Sciences and principal investigator of the study. "By capturing relationships across frequencies and time, we expanded our analysis beyond shimmer, jitter and other predefined voice features and found complex combinations of acoustic patterns and features that weren't on anyone's radar. We are energized by the findings as we continue to explore associations between vocal biomarkers and type 2 diabetes."
The research builds on Klick Labs' 2023 Voice to Diabetes study in Mayo Clinic Proceedings: Digital Health , which analyzed fixed one-sentence smartphone voice recordings alongside participants' age, body mass index (BMI) and other basic health information.
Source link