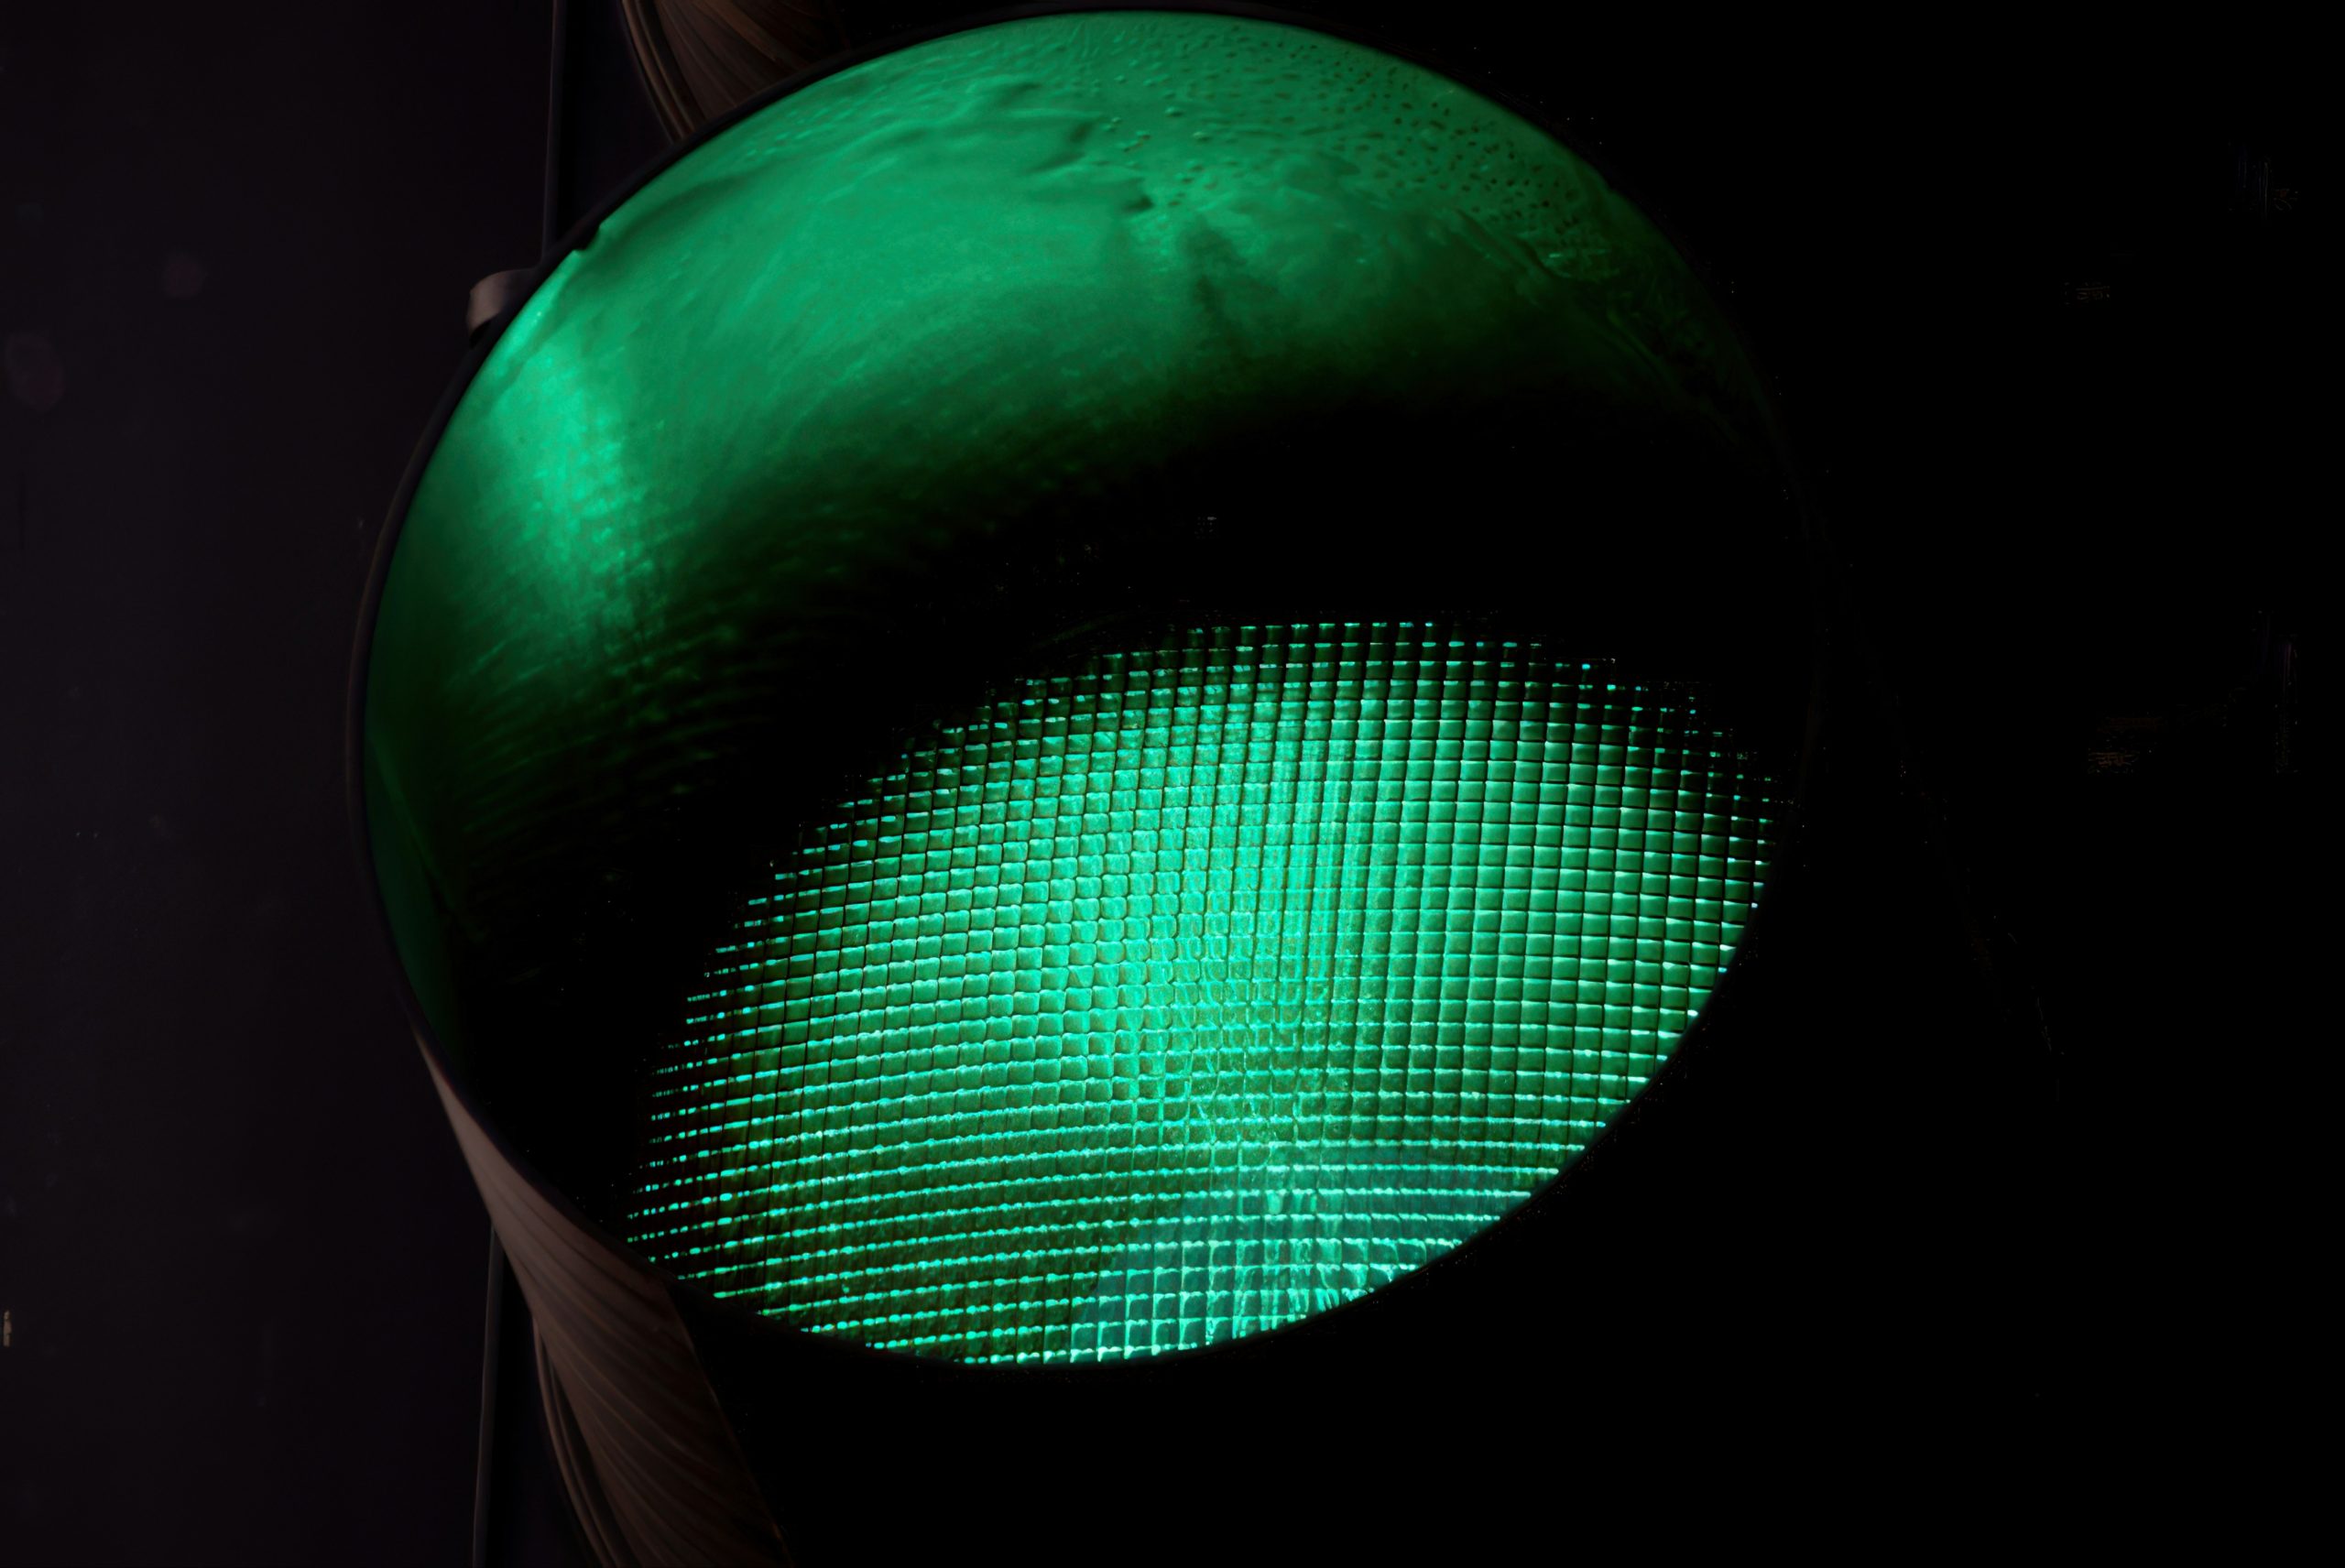
In cloud-native operations, few scenarios are as maddening as the “phantom slowdown.” This happens when Grafana or Kubernetes dashboards show a sea of green: pods are running, liveness and readiness probes return success codes, and node CPU utilization stays well below capacity limits. Yet users submit urgent tickets complaining of sporadic, severe latency when querying an application or waiting for an AI model’s response.
Why do basic health checks pass inspection while application performance degrades? And how can engineering teams trace the root cause when the issue is intermittent and spans multi-tier hybrid infrastructure?
To understand the mechanics of these sometimes evasive performance regressions, The New Stack spoke with Mahesh Ramachandran, who leads product management for HPE OpsRamp Software.
Ramachandran tells TNS how continuous telemetry and retrospective analysis help teams investigate intermittent slowdowns, and how AI-assisted investigation can complement dashboards.
Part 1: Developers and platform teams both want Kubernetes self-service. They disagree on who owns it.
Part 2: A live Kubernetes cluster can still have an ownership gap
Kubernetes probes report whether their configured checks succeed. A liveness probe helps determine when to restart a container, including one whose process is running but stuck. A readiness probe helps determine whether a container is ready to accept traffic.
Custom checks can include application or dependency conditions, but passing a basic probe doesn’t mean a complete user request meets its response-time target. Teams still need application performance measurements.
“Consider a composite scenario based on what we see across enterprise deployments,” Ramachandran says.
Source link