See more from Canary Media’s “Chart of the Week” column.
Have you ever gazed up at power lines and wondered how clean the electrons passing along them are? The answer is very different depending on where you are.
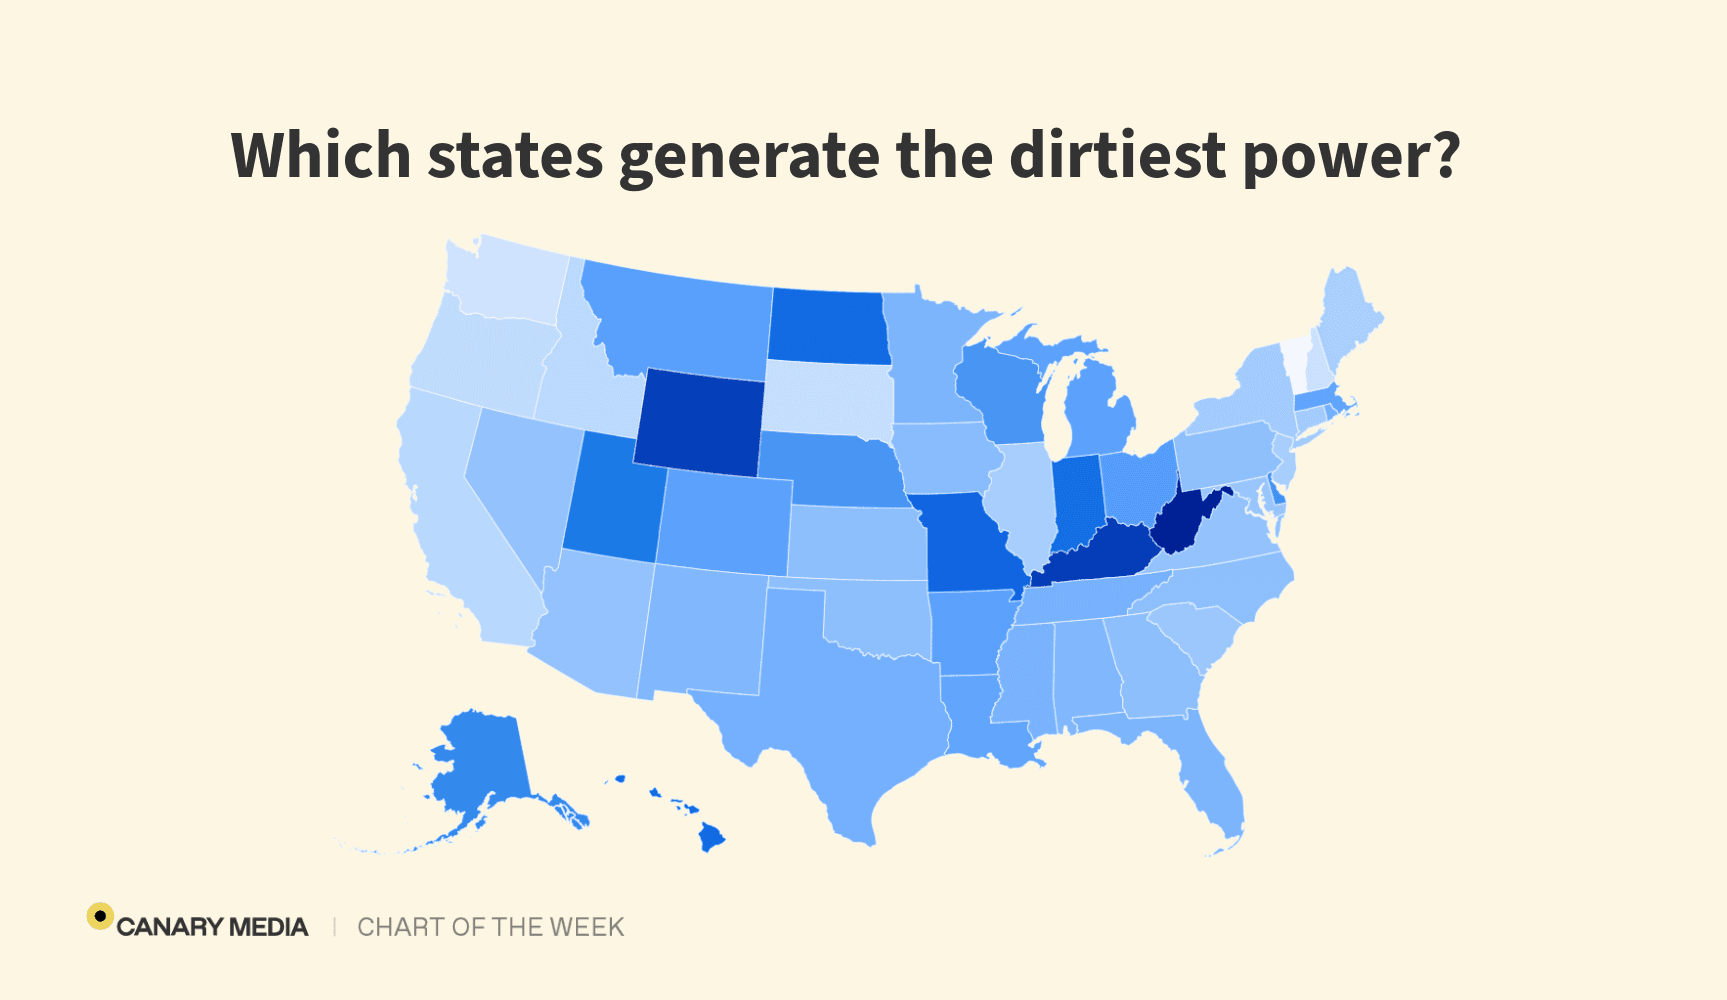
Just look at the spectrum of blues in the map above. It charts the carbon intensity of power generated in each state in 2024, according to federal data compiled by U.S. Energy Data, a new project from the think tank Institute for Progress. Carbon intensity is the amount of planet-warming carbon pollution emitted per megawatt-hour of electricity generated.
The states with the highest carbon intensity burn a lot of fossil fuels, especially the really dirty kinds like coal and petroleum. In the three states with the dirtiest electricity generation — West Virginia, Kentucky, and Wyoming — most power is created by burning coal, which makes sense considering they are among the top coal-producing states.
States with the lowest carbon intensity, of course, are home to a larger share of clean energy, ranging from wind and solar farms to hydroelectric facilities to nuclear plants. Vermont has the cleanest in-state generation, with essentially 100% of the power it creates coming from renewables — largely hydropower — since 2015.
It’s important to note that the above map represents the power generated in a state — not necessarily the power consumed there. Wyoming, for example, generates about 12 times more power than it consumes. Electricity flows all over the place via sweeping interregional transmission lines — so even a state with a high share of clean power generation could have a dirtier grid than meets the eye.
Source link