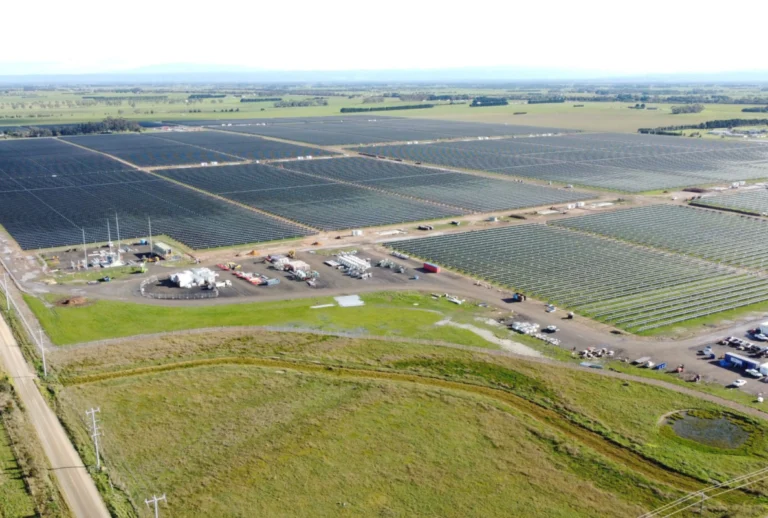
Victoria led all states on combined output, generating 1.52TWh across both technologies, comprising 1.25TWh from wind and 267GWh from utility PV.
The top-performing utility PV assets for the month were concentrated in New South Wales and Queensland, each recording a 35% AC capacity factor.
This includes ACEN Australia’s Stubbo stages 1 and 2 in NSW, Hana Financial Investment’s Columboola in Queensland, and the ENEOS Group and Sojitz Corporation joint venture at Edenvale, also in Queensland.
Wind performance was led by Potentia Energy’s Flat Rocks in Western Australia at 55%, followed by two Tasmanian assets, Atmos Renewables’ Cattle Hill at 49% and the Atmos Renewables and Palisade Investment Partners joint venture at Granville Harbour at 48%.
Wind generation moved in the opposite direction to solar nationally, falling or holding flat in every NEM state except Queensland. Total wind output was down by approximately 86GWh compared with September 2025.
Utility PV curtailment fell to 22% of available generation in September 2026, down from 26% in September 2025, while wind curtailment held broadly flat at around 13%.
The improvement extends a trend already visible in Rystad’s August data, when NEM utility PV curtailment fell to around 9% of available generation, down from roughly 18% a year earlier, as utility-scale solar generation climbed to a combined 4.99TWh with wind.
September’s curtailment rate remains structurally higher than August’s, reflecting the seasonal pattern in which curtailment tends to peak in spring as solar output rises faster than underlying demand, but the year-on-year direction in both months points in the same direction.
Source link