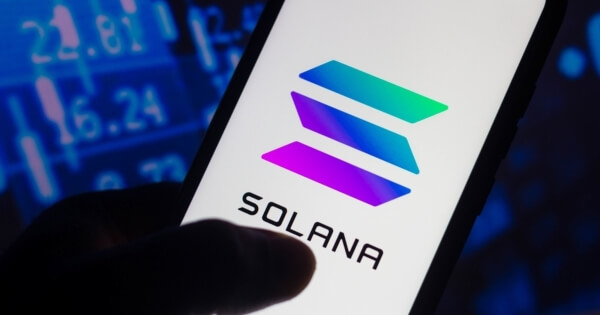
Solana is trading at $109.89 on Binance spot as of October 10, 2026, fractionally below its Bollinger lower band with a MACD histogram at zero and RSI at 44.11. CoinDCX set an October 2026 price ta...
Market analysis includes conditional scenarios, not assured price outcomes or investment advice. Check the data, assumptions and dates cited.
As of the October 10 observation, SOL is printing $109.89 on Binance spot — a decline of 0.63% across the prior 24 hours — within a session range of $108.45 to $112.06. The more consequential data point is the Bollinger Band position: the lower band sits at $109.97, and the %B reading of -0.0053 places price fractionally beneath it. That reading is not a buy signal in isolation; it indicates that realized volatility has compressed the band tight enough that the current print has slipped below the statistical boundary defined by the 20-day SMA (middle band: $117.80) plus or minus two standard deviations.
The distance between current price and the middle band is roughly $7.91, or approximately 7.2%. That gap frames how far SOL has drifted from its recent average, not how far it might travel next.
Every short-term average sits above spot. 41 — a dense ceiling between $113 and $118. 74, both of which sit below even the EMA 26. That layering means any recovery attempt faces incremental friction before reaching the moving average cluster.
Source link