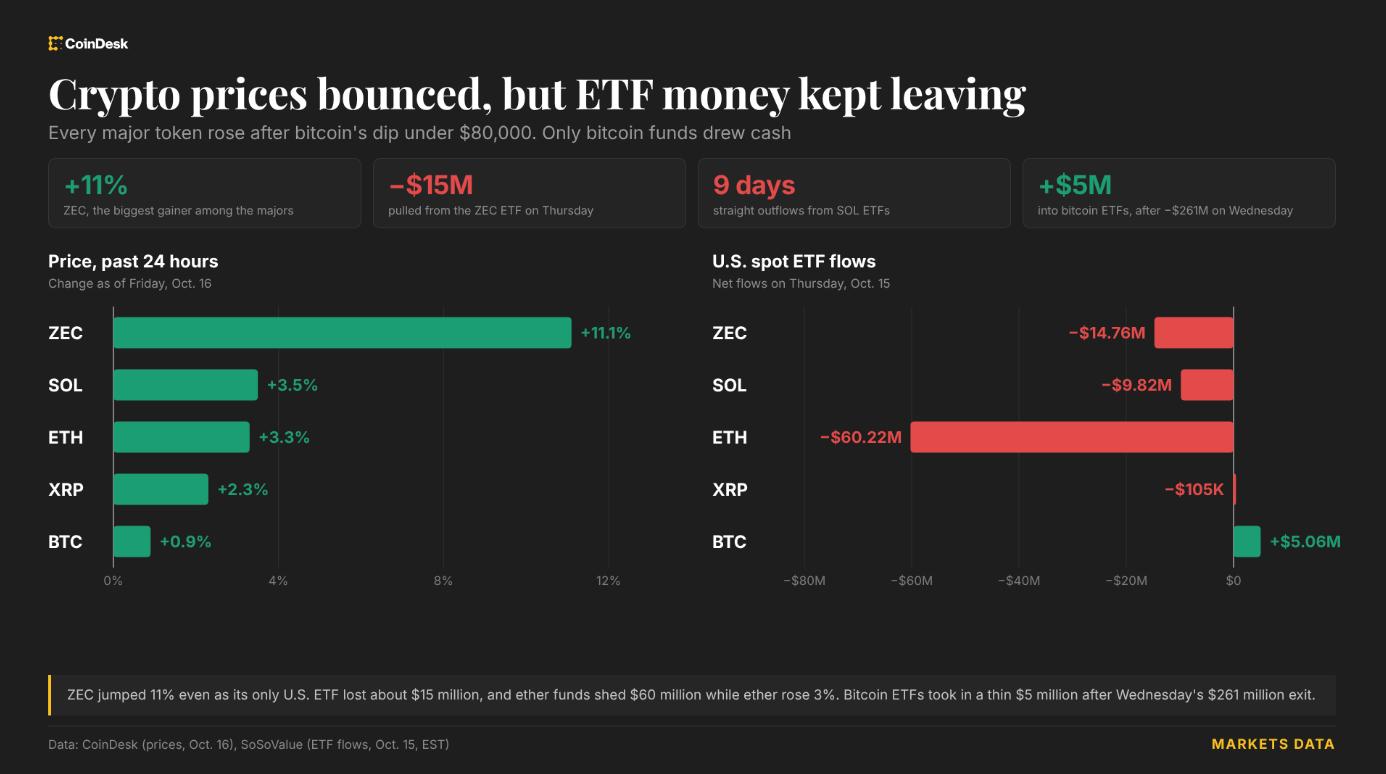
Ethereum recovered 4.11% to $2,454.83 on October 16, but the price remains stuck beneath every meaningful short-term moving average, with a MACD at zero and RSI at 41. FXEmpire analysts have flagge...
Market analysis includes conditional scenarios, not assured price outcomes or investment advice. Check the data, assumptions and dates cited.
Ethereum posted a 24-hour gain of 4.11%, lifting from an intraday low of $2,324.22 to a session high of $2,467.05, with the last traded price sitting at $2,454.83 on Binance spot as of the October 16 observation window. The move is notable for its speed but, taken in isolation, doesn't resolve the structural problem: ETH is trading below its 7-day SMA ($2,472.44), 20-day SMA ($2,589.09), 50-day SMA ($2,553.93), EMA 12 ($2,511.45) and EMA 26 ($2,546.96). The only moving average providing a bullish anchor beneath current price is the 200-day SMA at $2,145.95, which sits roughly $310 below the market.
That stack of resistance levels immediately overhead means the bounce has absorbed buying without confirming a trend reversal. The immediate resistance level derived from the supplied data sits at $2,506.51, with strong resistance at $2,558.20 — both below the cluster of MAs that must be reclaimed before any medium-term case can be made.
Writing for FXEmpire on October 13, Yashu Gola identified a double-bottom chart pattern on Ethereum suggesting a potential 10% rally toward $2,760, but explicitly conditioned that call on a breakout above the $2,578–$2,590 zone. As of the October 16 observation, price is roughly $125–$135 below that confirmation threshold.
Source link