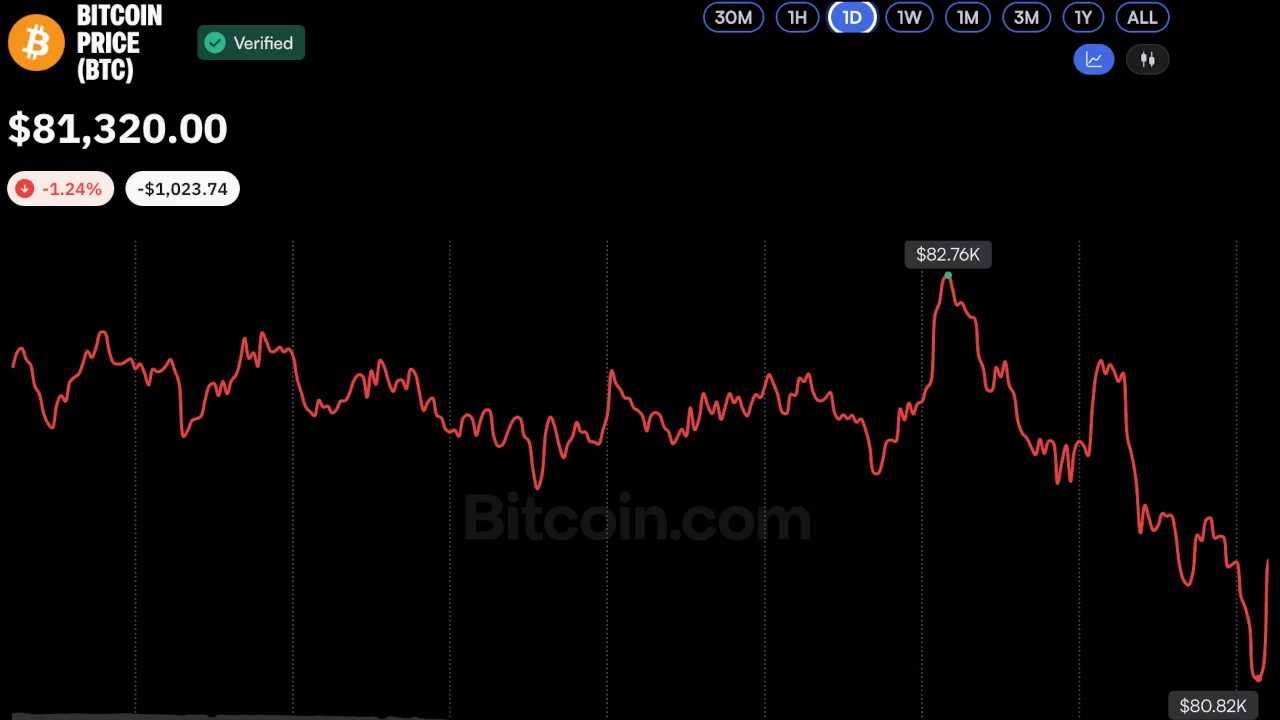
Bitcoin was trading at $82,212 on October 16, 2026, up 1.53% over 24 hours yet pinned below its 7- and 20-day moving averages, with the MACD histogram collapsing to zero — signalling a momentum inf...
Market analysis includes conditional scenarios, not assured price outcomes or investment advice. Check the data, assumptions and dates cited.
Bitcoin rose 1.53% over the prior 24 hours to $82,212, with the intraday range spanning $79,800 to $82,634 on Binance spot. The bounce is measurable, but the moving-average structure tells a more equivocal story. Price sits below the 7-day SMA ($82,560), the 20-day SMA ($83,644), the 12-period EMA ($82,857), and the 26-period EMA ($82,587) — every short-term average is acting as overhead. The 50-day SMA at $81,296, which price has reclaimed during the session, offers the only near-term support from the MA stack. Further back, the 200-day SMA at $72,401 confirms the longer-term structural trend but carries no direct bearing on the immediate decision zone. A market trading above its medium-term trend but below all of its short-term averages is one that has recovered from a sell-off without confirming a resumption — that is the honest read of the data.
The most pointed signal in the current setup is the MACD histogram. 0000 — a reading the supplied data explicitly flags as indicative of bearish momentum. The histogram reaching zero means the two MACD components have fully converged; the next bar determines whether momentum re-accelerates to the upside or tips negative. It is a genuine inflection, not a lagging confirmation.
Source link