

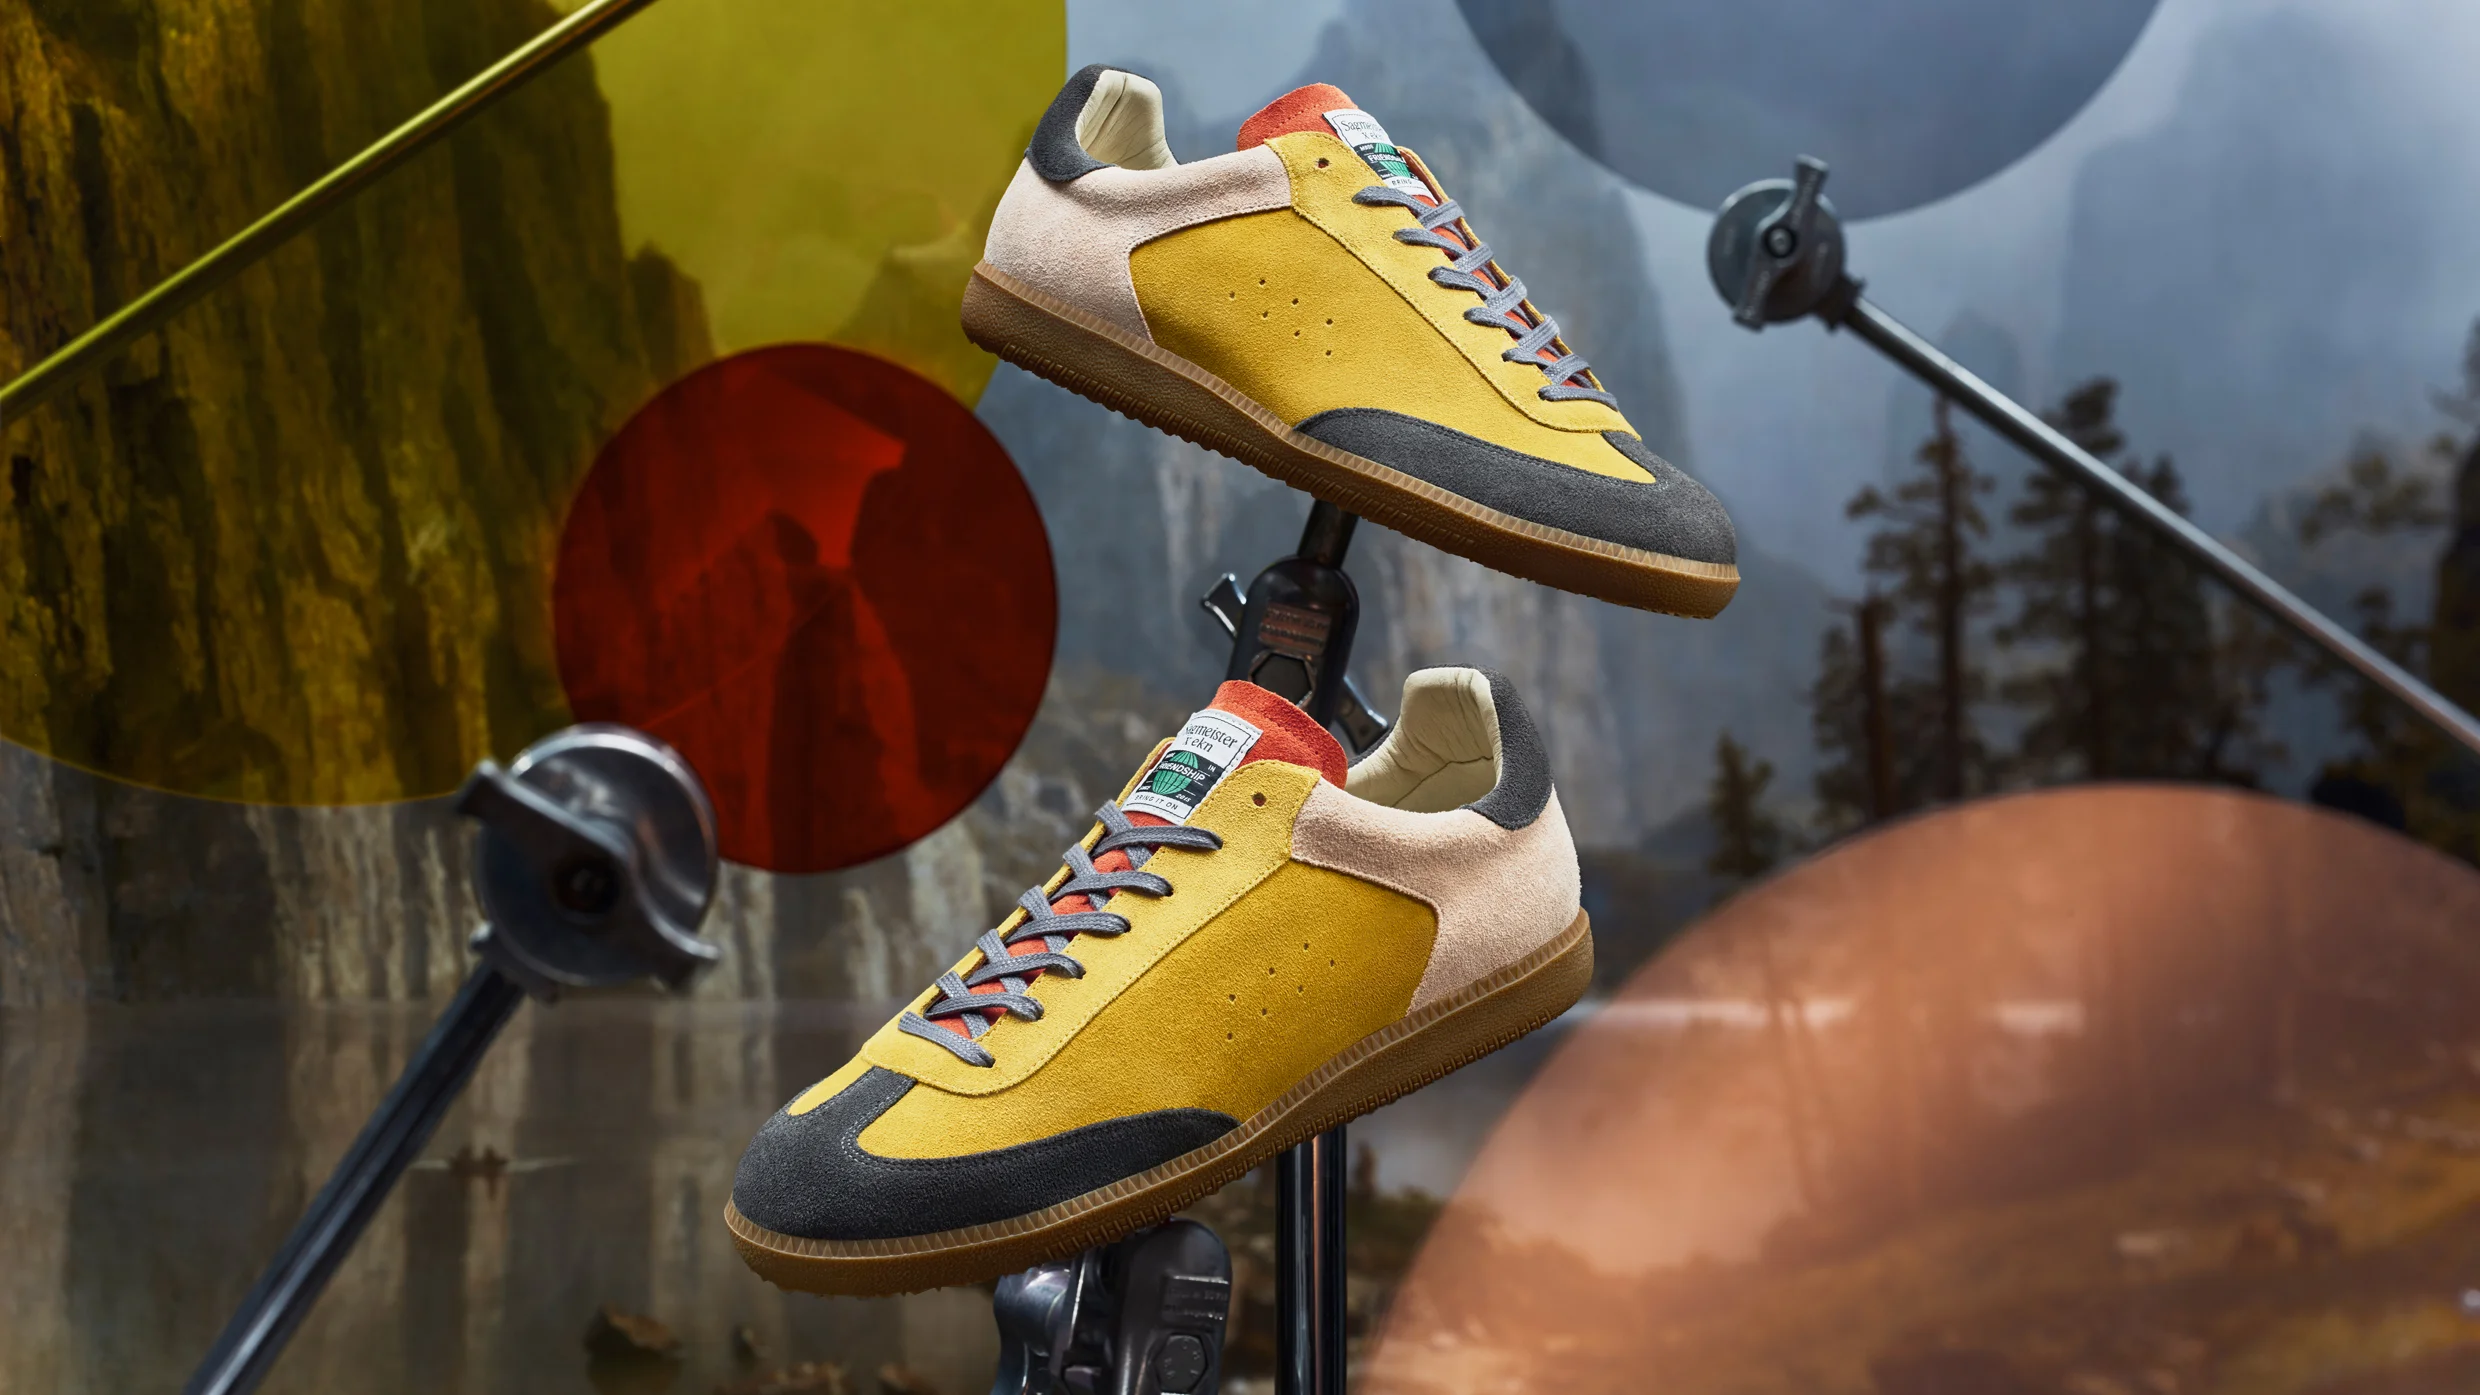
Data visualization turns charts, data, and statistics into something easier to comprehend. Turning that data viz into shoes makes the data into a functional conversation starter.
That’s what the Austrian graphic designer Stefan Sagmeister did with two shoes he designed for Ekn, a German footwear brand, that are on view at his exhibition Finally, Something Good at the Paris gallery Gaîté Lyrique through April 2027.
Sagmeister says the exhibition is meant to look at the world over the long term rather than through daily news. Each shoe uses data to tell a story: one about renewable energy, and the other about homelessness. The key to understanding what the shoes say is written in the footbed.
The Bring It On, a multicolored sneaker about renewable electricity, uses data from the Energy Institute’s 2024 Statistical Review of World Energy to inform the relative sizes of color panels on its sides, with each leather panel representing a different energy source. Yellow, the largest color, represents hydropower, followed by black for wind, pink for solar, and red for all other renewables.
“Wonderfully, the shoe is already out of date,” Sagmeister tells Fast Company. “In the 2025 figures, published this summer, solar passed wind for the first time, so today the pink panel should be slightly bigger than the black one.”
His other shoe, Like a Complete Unknown , is a boot that uses circles to represent the relative homeless populations of six countries. The area of each circular appliqué corresponds to the number of people who are living in the streets and public spaces per 100,000 inhabitants, according to OECD data.
Source link