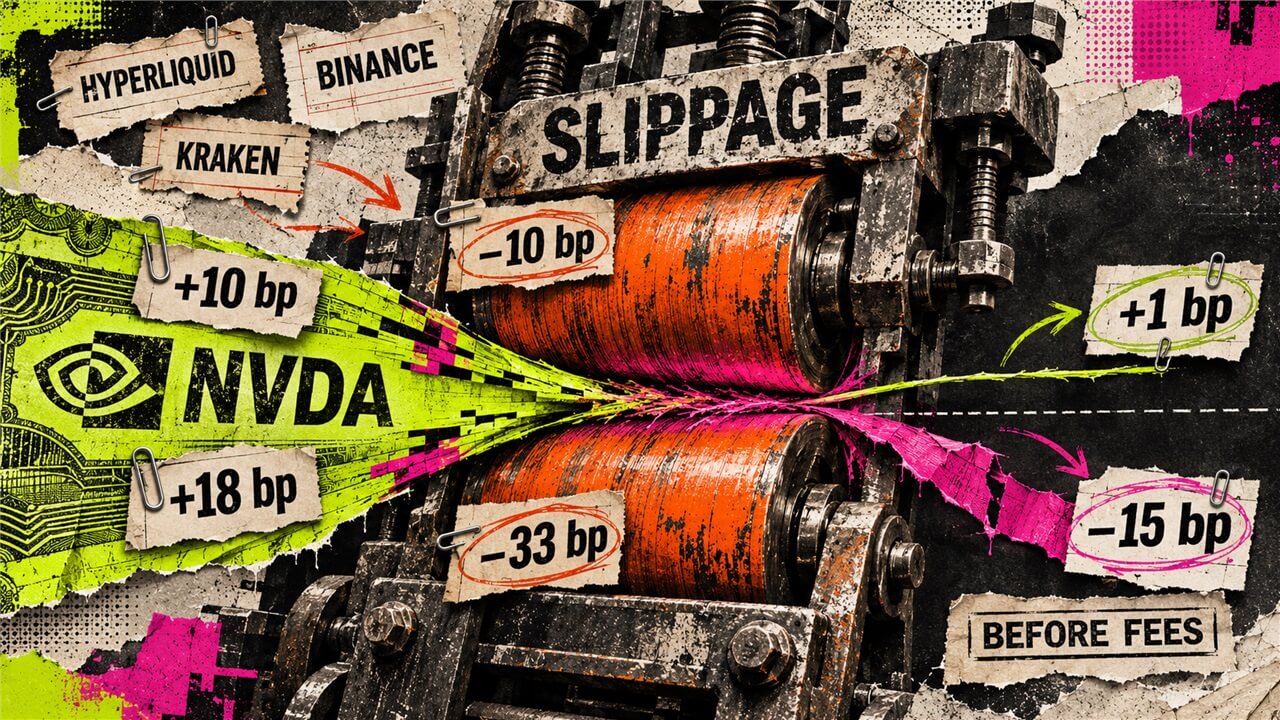
Two $1,000 comparisons leave about 1 basis point and negative 15 before fees, while access and share adjustments complicate the trade.
Tokens tracking Nvidia shares can trade at different prices across issuers and exchanges, but buying the cheaper version and selling a dearer one leaves little room for profit in two modeled comparisons published by data provider Coin Metrics on Nov. 3.
The data provider's execution study shows about one basis point remaining in one $1,000 comparison after entry and exit slippage, and a negative 15 basis points in another.
The results show how a visible price difference can shrink when an order reaches the market, while preserving a small positive remainder in the first example.
A holder must compare the same share exposure, have something to sell on the expensive side, and qualify for the route used to settle the trade.
Coin Metrics' spread and slippage chart compares buying Hyperliquid NVDAx with selling Binance NVDAb, printing a gross gap of 10 basis points, entry and exit slippage of 10 basis points, and a one-basis-point remainder before trading fees.
Thanks for signing up to The Catalyst. Look out for your first daily email. If you already receive it, you’re all set.
Its second comparison buys Hyperliquid NVDAx and sells Kraken NVDAx. There, an 18-basis-point gross gap faces 33 basis points of entry and exit slippage, leaving a negative 15-basis-point gap before fees.
Source link