Litecoin traded at $59.04 on Binance spot as of October 18, 2026, printing below its SMA 7, SMA 20, SMA 50, EMA 12, and EMA 26 simultaneously, while the Stochastic %K fell to 12.64 — deep in overso...
Market analysis includes conditional scenarios, not assured price outcomes or investment advice. Check the data, assumptions and dates cited.
At $59.04, Litecoin sits below every near-term moving average in the supplied dataset. The SMA 7 stands at $60.03, the SMA 50 at $60.13, the EMA 12 at $61.72, the EMA 26 at $62.47, and the SMA 20 at $64.69 — each one acting as overhead resistance in descending order. That compression of the short- and medium-term averages into a tight cluster just above spot price describes a chart where rallies have repeatedly found sellers. The one structural counterweight is the SMA 200, currently at $51.95, which remains well below current trade. Price has held above that long-term baseline, meaning the broader trend floor has not been violated — but that observation does nothing to change the near-term pressure.
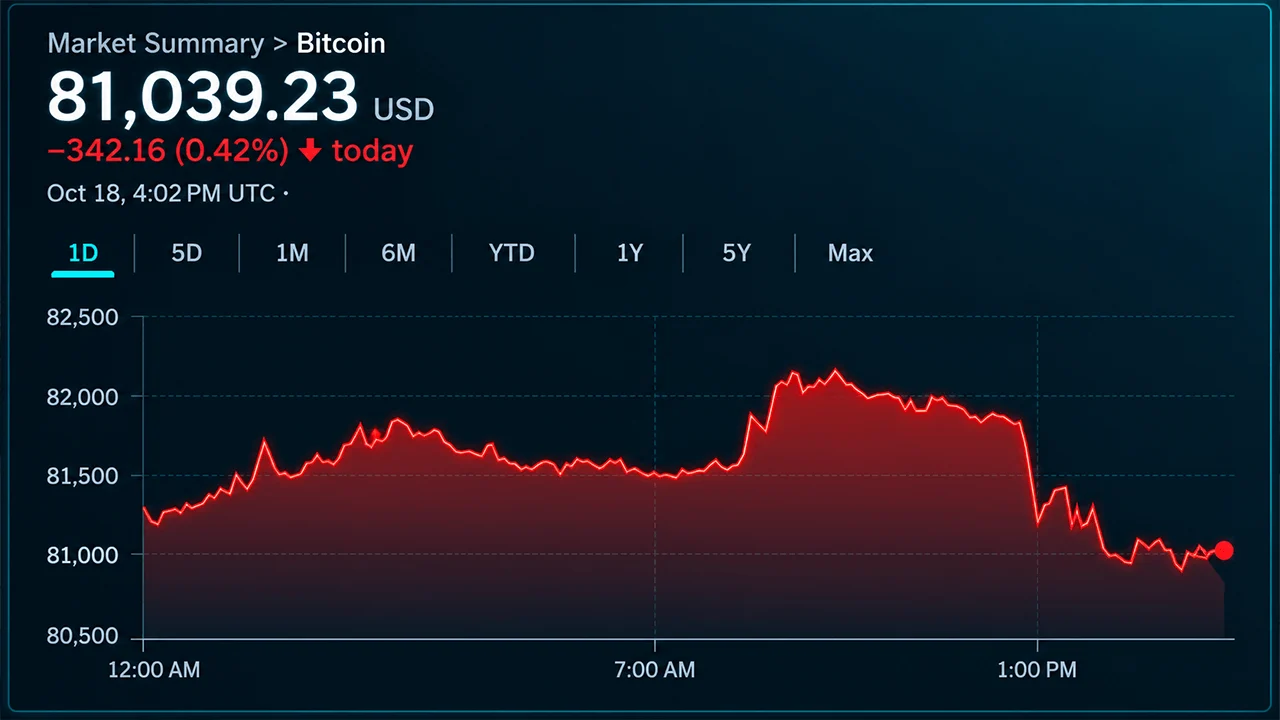
The 24-hour trading range on Binance spot ran from $57.60 to $59.71, a span of roughly $2.11 against a 14-period ATR of $2.82. That places the intraday swing at about 75% of average daily volatility, suggesting the market has not yet expressed its full typical range on this session.
23, which the supplied data characterises as neutral — not yet in oversold territory by the conventional 30-level threshold, but directionally tracking lower. 11 place both lines well below the 20 threshold, a reading that, in isolation, signals the near-term price swing has been stretched to the downside.
Source link