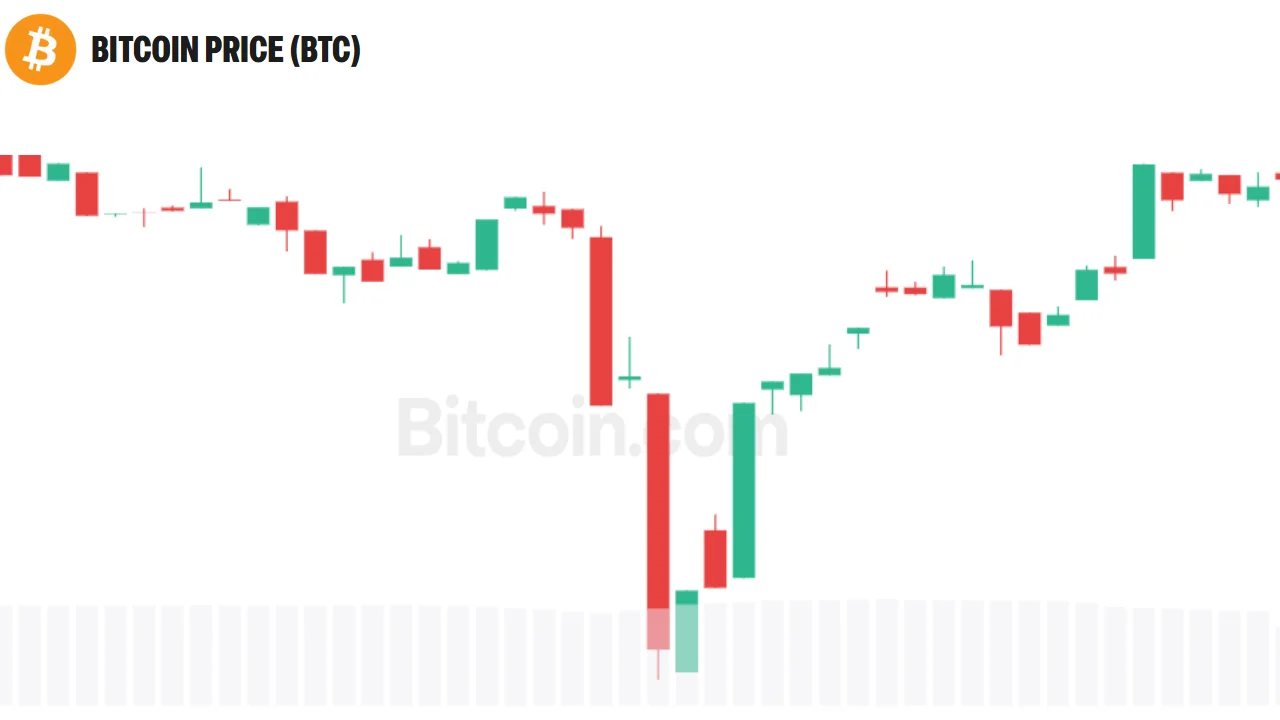
Curve (CRV) is trading at $0.34 on Binance spot on October 25, 2026, down 2.57% over the prior 24 hours, with price sitting beneath a tight band of short-term moving averages that now functions as ...
Market analysis includes conditional scenarios, not assured price outcomes or investment advice. Check the data, assumptions and dates cited.
CRV printed a 24-hour range of $0.34–$0.36 on Binance spot and settled at the bottom of that range, per supplied market data. The retreat has left price below the 7-day SMA at $0.37, the 20-day SMA at $0.36, the 50-day SMA at $0.36, and both the EMA 12 and EMA 26 at $0.36. When four separate averages compress into the same $0.36–$0.37 zone, that cluster typically becomes a zone of layered overhead supply rather than a single clean level to reclaim.
The longer-term picture is less unambiguous. The 200-day SMA sits at $0.27, roughly 26% below current price. That gap indicates the intermediate recovery remains structurally intact — the near-term deterioration is happening well above the long-term mean, not at it.
The MACD line and its signal line are both at 0.0012, producing a histogram reading of exactly 0.0000 — flagged in the supplied data as bearish momentum. A histogram at zero signals convergence rather than divergence: the directional gap between the two lines has closed, meaning momentum has stalled. There is no sharp downside acceleration implied by this reading, but equally no evidence of a new bullish impulse building.
88 occupies neutral territory. It has not reached the 30 level associated with oversold conditions, so no mechanical bounce signal exists yet.
Source link