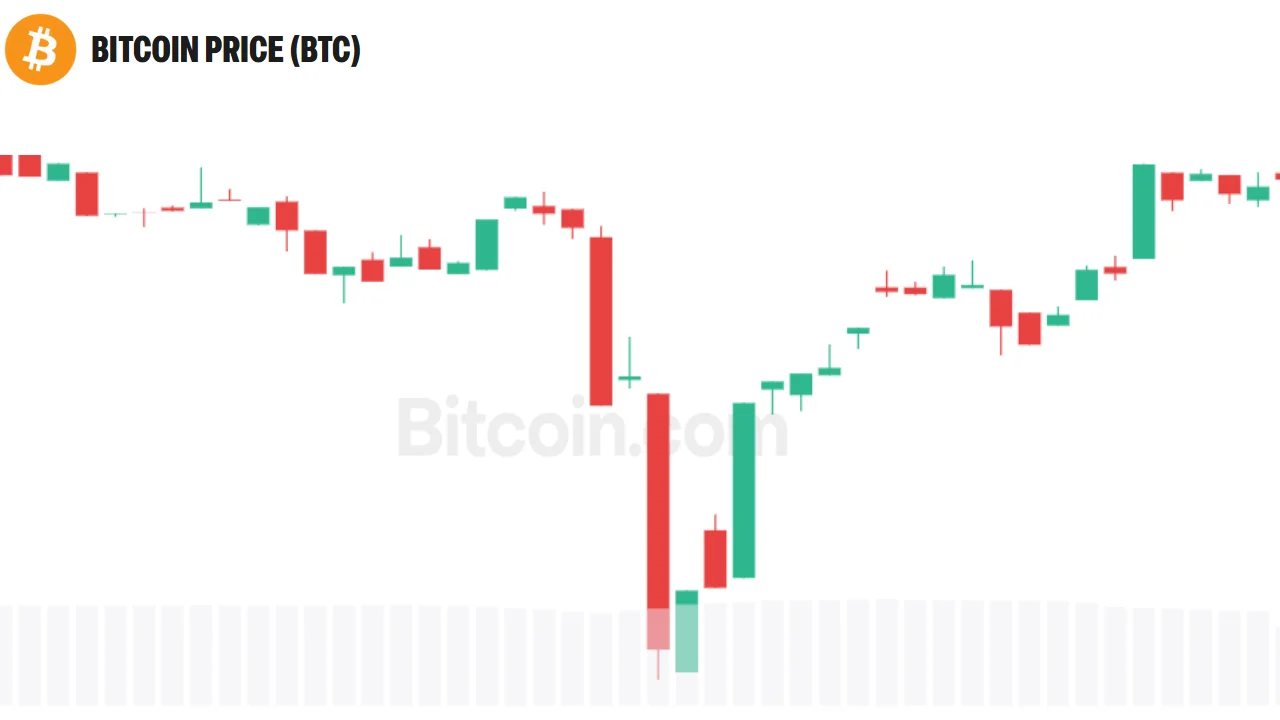
Bitcoin is trading at $80,538 on October 25, 2026, below its 7-, 20- and 50-day moving averages, with taker flow skewed heavily toward selling. Analyst targets of $82,000 and $85,000 remain conditi...
Market analysis includes conditional scenarios, not assured price outcomes or investment advice. Check the data, assumptions and dates cited.
Bitcoin opened the October 25 session at $80,538.01, down a modest 0.32% over the prior 24 hours and contained within a $79,221–$81,034 range on Binance spot. The headline move is almost a distraction from the more structural problem: every short-term moving average — the 7-day SMA ($81,870), 20-day SMA ($82,364), 50-day SMA ($81,861), EMA-12 ($81,872) and EMA-26 ($82,149) — sits above current price. That kind of clean sweep across timeframes reflects sustained distribution rather than a brief intraday dip. The 200-day SMA at $72,990 remains well below, which keeps the longer-term trend structurally intact, but it offers no near-term support at current levels.
Bollinger Band positioning reinforces the softness. A %B reading of 0.1146 places Bitcoin close to the lower band at $79,995, with the upper band at $84,733 and the midline (the 20-day SMA) at $82,364. The 14-day ATR of $2,104 is a material figure: it means a single average daily swing can span the entire corridor between immediate support and immediate resistance, amplifying the difficulty of holding any intraday level with conviction.
01 is in neutral territory — soft but not at a level that signals capitulation. 56 are both in oversold territory, a condition that historically precedes mean-reversion bounces but carries no timing guarantee on its own.
Source link