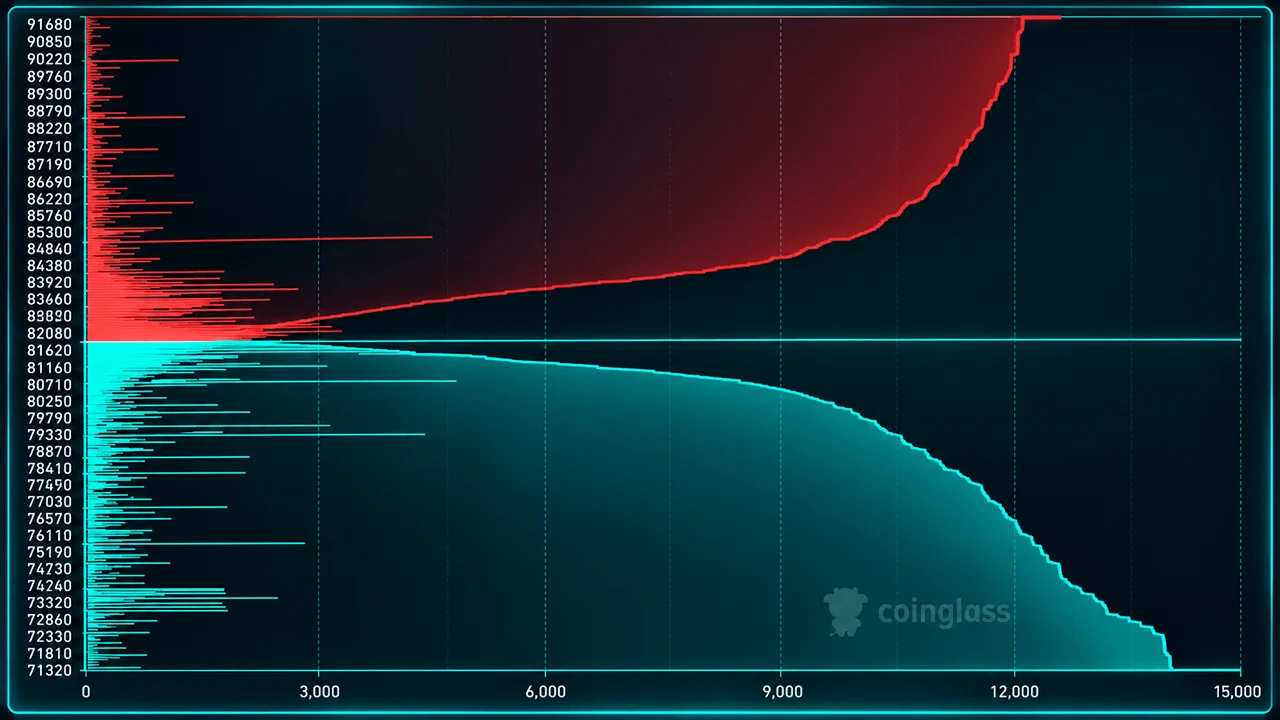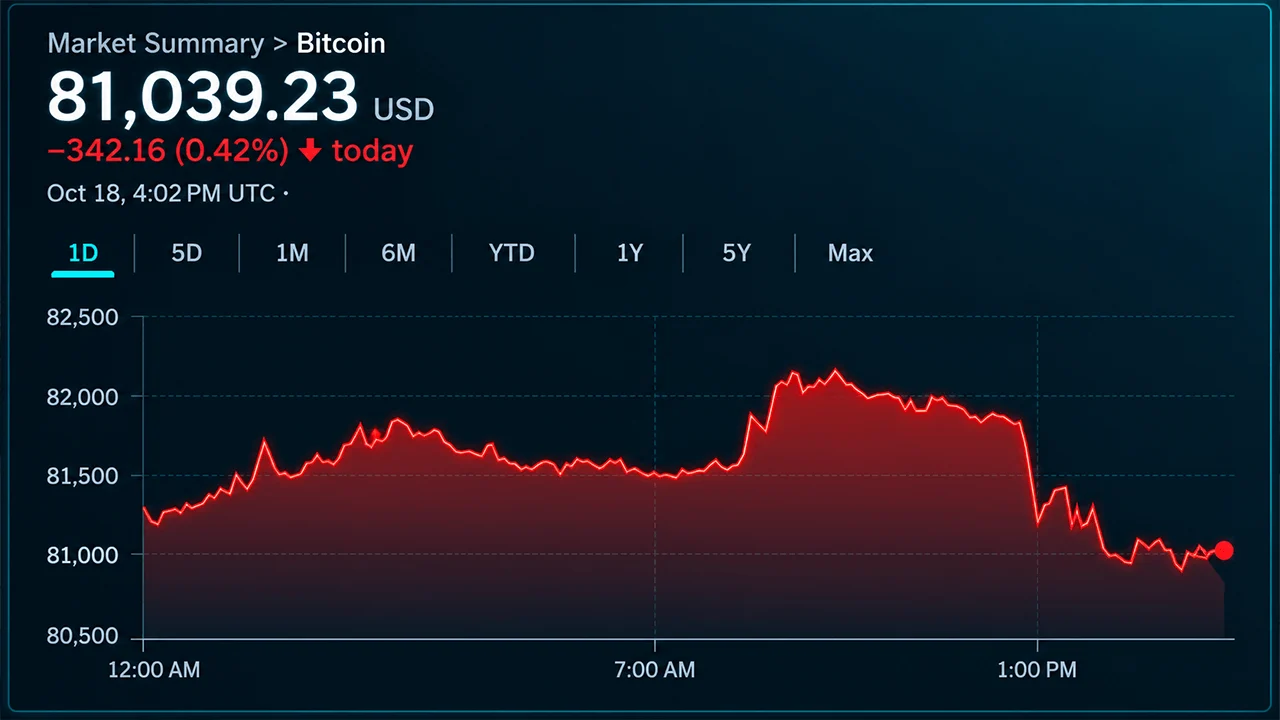
Bitcoin is trading at $81,743.67, up just 0.13% over 24 hours, with its MACD histogram at zero and price sitting beneath both the 7-day and 20-day moving averages. CoinDCX's October base-case targe...
Market analysis includes conditional scenarios, not assured price outcomes or investment advice. Check the data, assumptions and dates cited.
Bitcoin printed $81,743.67 at the time of this analysis, a 0.13% gain over 24 hours that amounts to statistical noise. The intraday range of $80,819.66 to $82,078.00 spans $1,258.34 — approximately 61.8% of the 14-period Average True Range of $2,036.09 sourced from Binance spot data, suggesting the market is coiling rather than trending. Volume on Binance spot over the same window came in at $606.2 million, providing no obvious directional conviction signal on its own.
The moving average stack reveals a market caught between near-term softness and intact structural support. Price sits below the 7-day SMA ($81,971.04) and meaningfully below the 20-day SMA ($83,377.81), the latter also serving as the Bollinger Band midline. Both readings place the immediate trend on the weaker side. Yet Bitcoin is holding just above its 50-day SMA at $81,428.06 — a level that has, so far, absorbed the pullback. The 200-day SMA at $72,532.62 remains well below current price, preserving the longer-term structural orientation.
The short-dated exponentials add a specific technical data point. 6772. 0000. The supplied data classifies this as indicating bearish momentum. A zero histogram is not a crash signal; it marks the point at which a prior bullish impulse has fully dissipated into the signal line, leaving the next directional move unresolved.
Source link