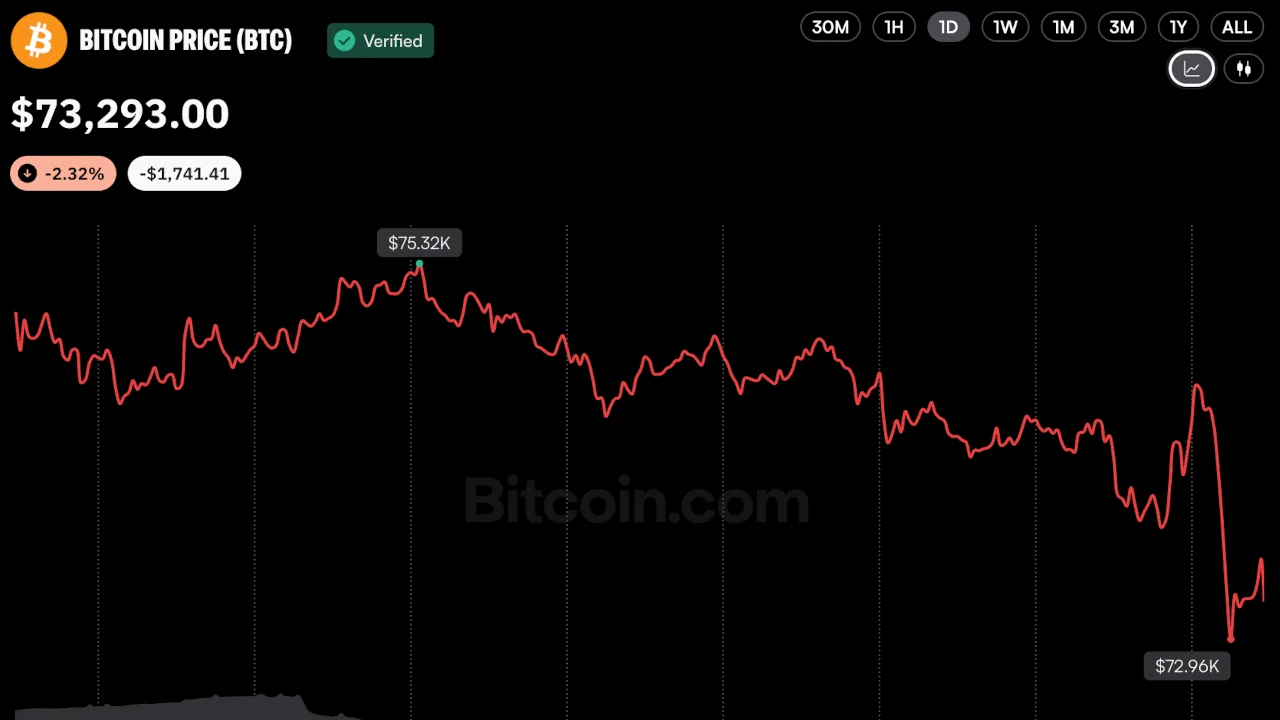
Bitcoin faces a key inflation test near $75,000 as Glassnode data shows sellers dominating spot trading and ETF outflows deepening.
Bitcoin's latest weekly trading data showed sellers retaining the initiative even as turnover rose, leaving its recovery near $75,000 without a clear sign that aggressive buyers were taking control.
The Nov. 9 report from blockchain analytics firm Glassnode sets a cautious starting point ahead of today's US inflation release.
Reuters reported closing gains of about 2.4% for the S&P 500 and 2.7% for the Nasdaq Composite on Nov. 9, with cheaper oil helping relieve inflation worries. Bitcoin was trading near $75,000 on Nov. 9, according to Glassnode.
Glassnode's latest Market Pulse put spot cumulative volume delta (CVD) at negative $92 million, compared with positive $7 million seven days earlier. Its spot volume indicator rose 13.3% to $6.4 billion from $5.6 billion.
CVD tracks the balance between aggressive buying and selling within the activity Glassnode measures. Negative CVD means aggressive selling outweighed aggressive buying in that measured activity.
The report's weekly indicators describe the demand conditions Bitcoin brought into the equity rally.
Glassnode's November 9 weekly snapshot shows spot activity rising while aggressive order flow turned negative, compared with seven days earlier.
Higher trading volume can accompany seller aggression. It does not by itself confirm renewed buying pressure.
Weekly report comparison, not Monday US-session data. Spot volume is an indicator, not a stated calendar-week total. Negative CVD concerns aggressive order flow within measured activity; every trade has a buyer. Separate scales do not compare dollar magnitudes across metrics.
Source link