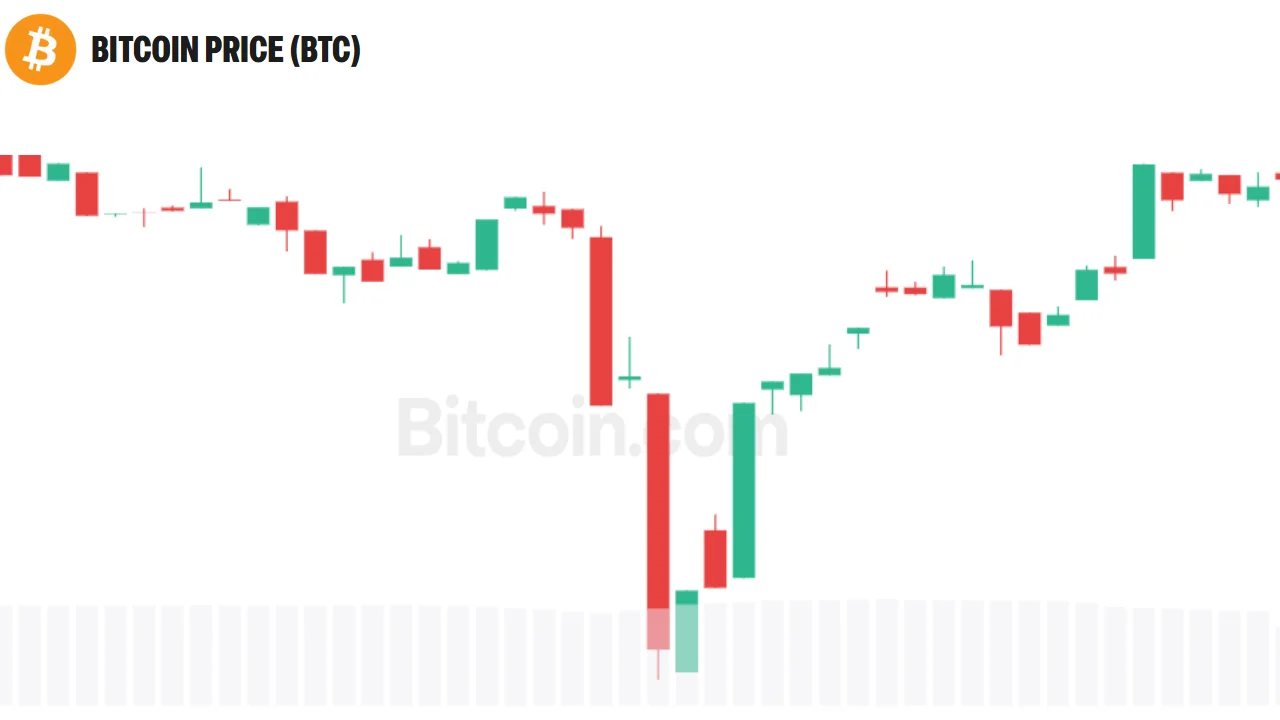
Bitcoin Cash slipped 0.40% to $275.40 on Binance spot data, sitting beneath its entire short-term and medium-term moving average stack while the MACD histogram printed exactly zero — the technical ...
Market analysis includes conditional scenarios, not assured price outcomes or investment advice. Check the data, assumptions and dates cited.
BCH was quoted at $275.40 on Binance spot, having shed 0.40% over 24 hours within a session range of $268.00 to $279.80. The most structurally significant feature is not the size of the decline but where the price is sitting relative to every tracked moving average. The 7-day SMA ($280.17), 20-day SMA ($280.15), 50-day SMA ($279.84), 200-day SMA ($289.24), EMA 12 ($279.88), and EMA 26 ($282.36) are all above the current print. That kind of uniform overhead alignment — across timeframes ranging from one week to roughly nine months — describes a market where short-term sellers have seized control at every horizon the data covers. The 24-hour Binance spot volume of $4,595,222 is the backdrop against which these levels have formed.
0000. The supplied data characterizes this as bearish momentum; more precisely, a histogram at zero marks the precise moment the gap between MACD and signal has closed, meaning the downward impulse measured by that spread has been fully spent at this reading. That is a deceleration event, not a directional reversal. Whether the histogram turns positive from here or curls back negative is the near-term mechanical question the data cannot yet answer.
Source link