

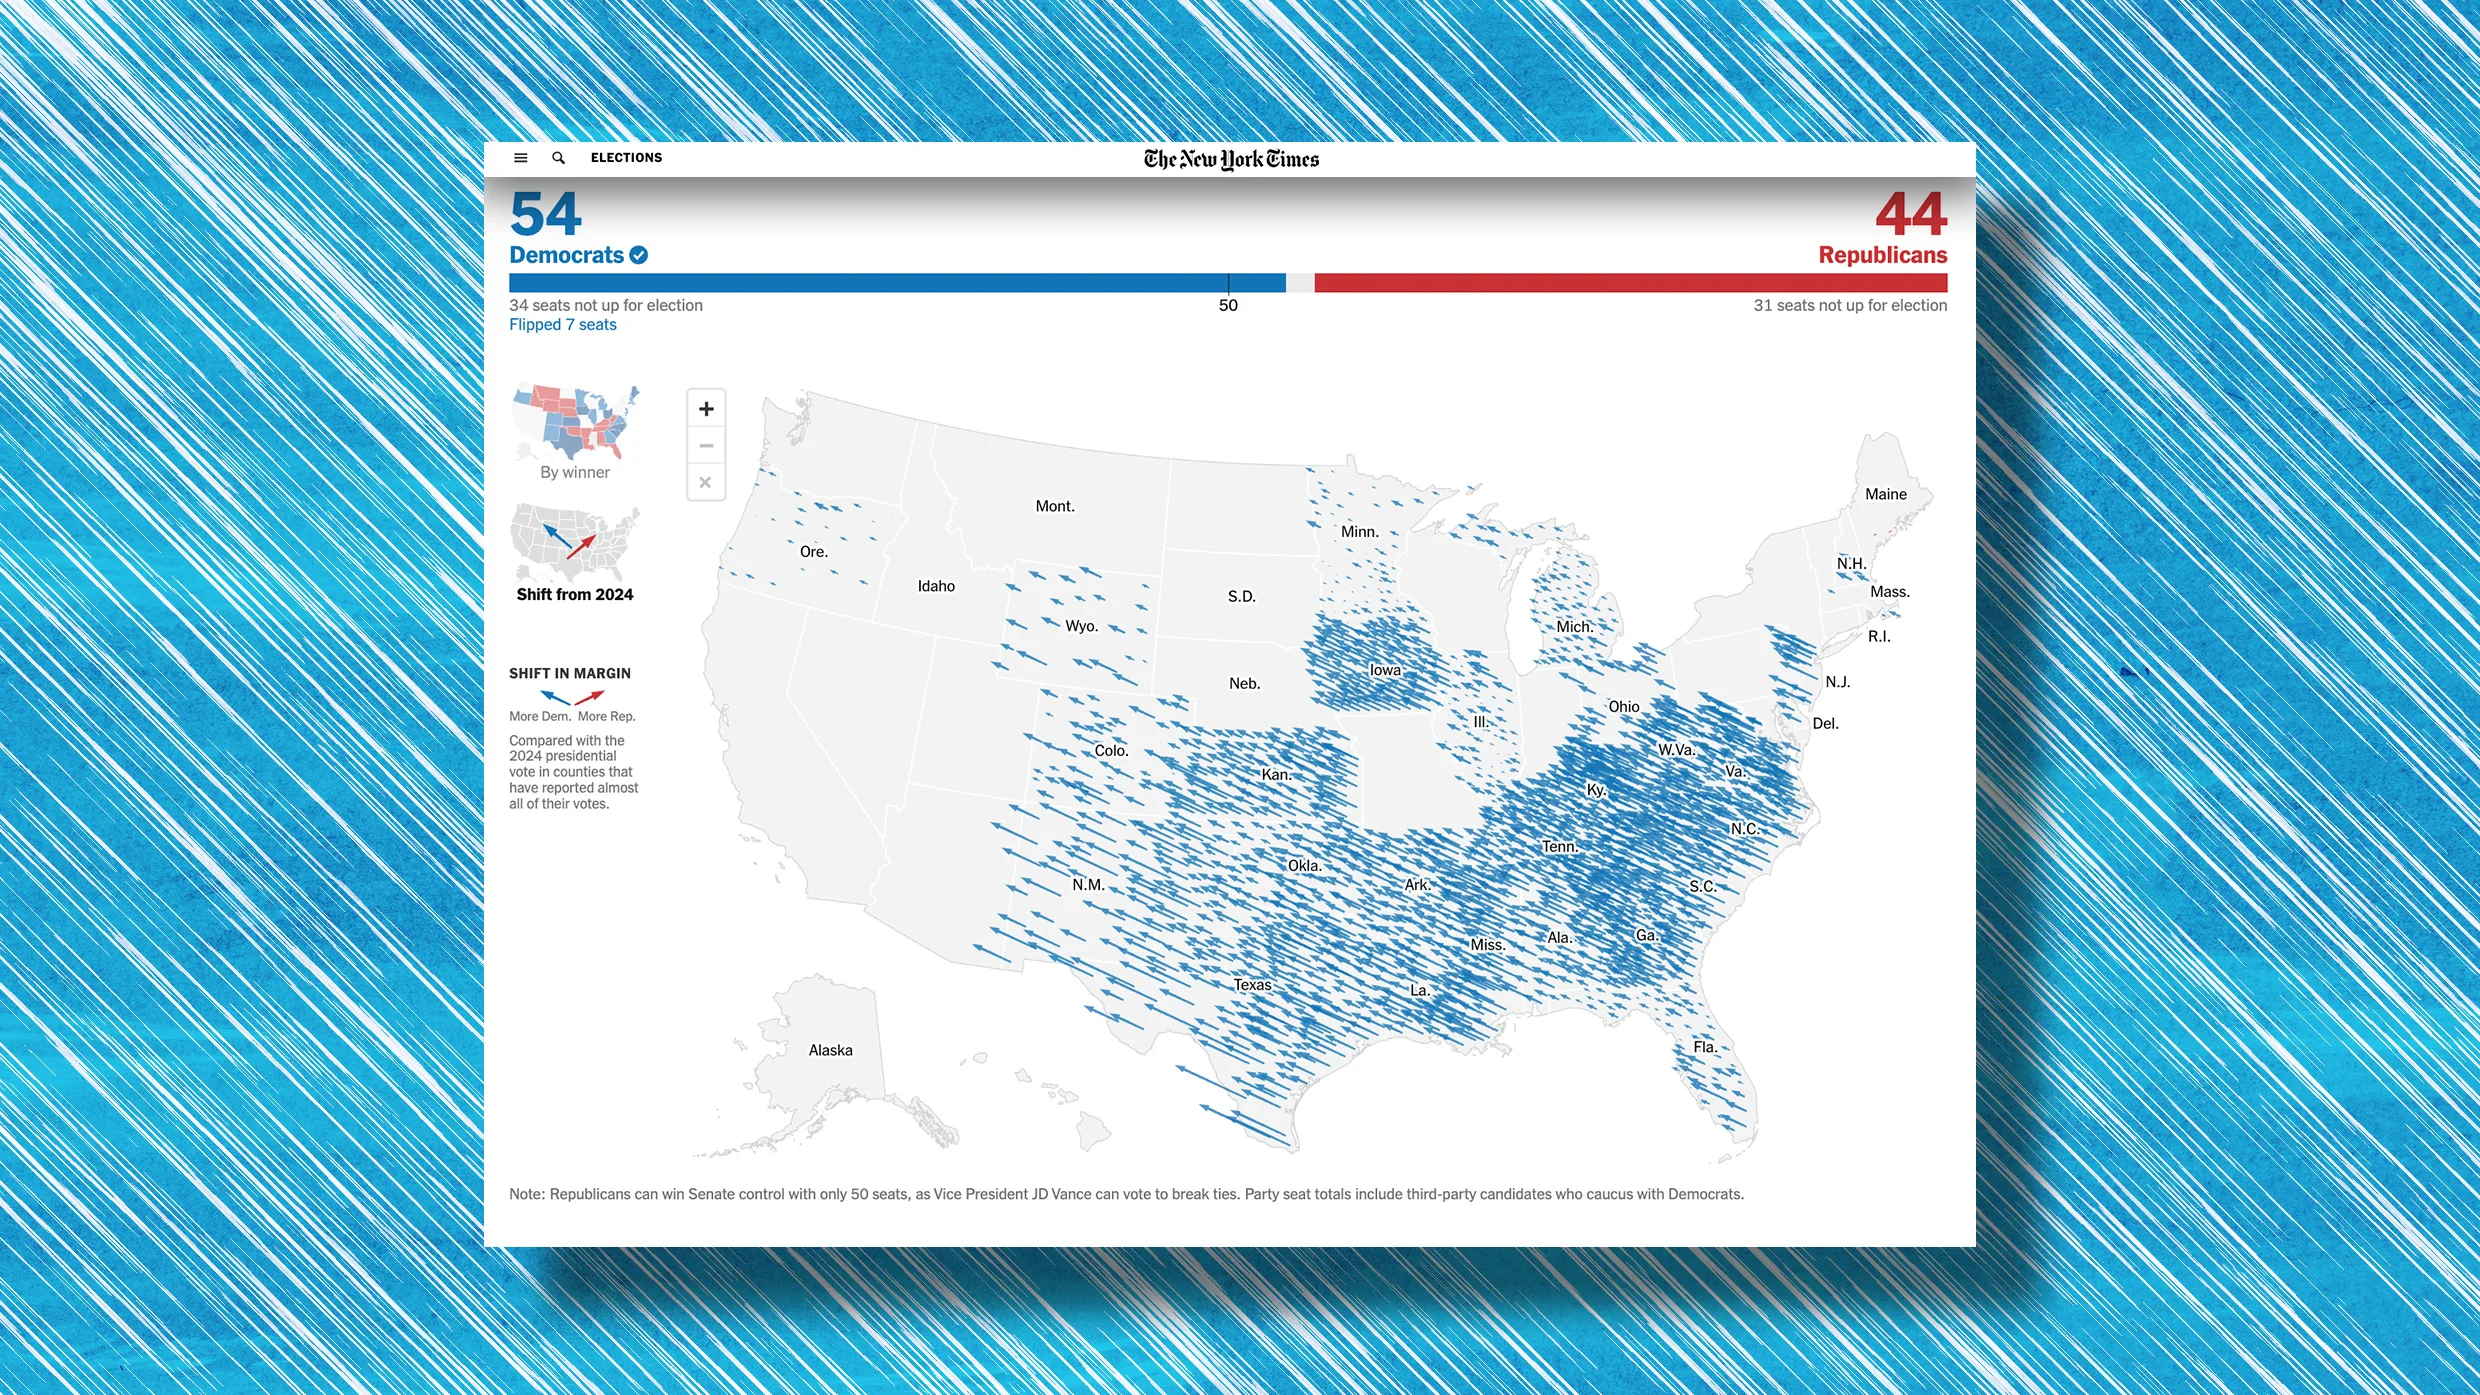
The 2026 election was a total political reset from 2024, with many states that voted for President Donald Trump last time swinging to the left and giving Democrats control of the next Congress. A pair of maps shows through arrows just how dramatic the change in just two years really was.
To communicate the shift in vote margin from one party to another from the most two recent elections, The New York Times has used an election results map with arrows that show the shift in each individual county where most votes are now counted. Blue arrows to the left show a trend towards Democrats compared to the last election while red arrows to the right show a trend towards Republicans. The longer the arrow, the bigger the shift. Two years ago, that map was covered in red. It’s now filled by a sea of blue arrows.
The Times first use the arrows map 10 years ago to show the vote shift in 2016, and Times graphics editor Wilson Andrews told Fast Company in 2024 the style “adds another layer of storytelling.” While typical election map graphics show you the winner or vote share, this map conveys a sense of time, giving viewers a look at how much political attitudes changed from one Election Day to another.
Trump won the national popular vote in 2024 after making campaign promises to lower prices and avoid foreign wars, but in office he did the opposite, by illegally imposing tariffs and launching a war with Iran.
Source link