

Want more housing market stories from Lance Lambert’s ResiClub in your inbox? Subscribe to the ResiClub newsletter.
During the Pandemic Housing Boom, housing demand was running so hot—and homes sold so quickly—listings barely even registered as active inventory. Indeed, in October 2021, there were only 565,707 active homes for sale, according to Realtor.com’s data series. That was a staggering -53.8% below the 1,208,311 active listings in October 2019.
At the end of October 2020 and October 2021, not a single one of America’s 200 largest metro area housing markets had more inventory than in pre-pandemic October 2019.
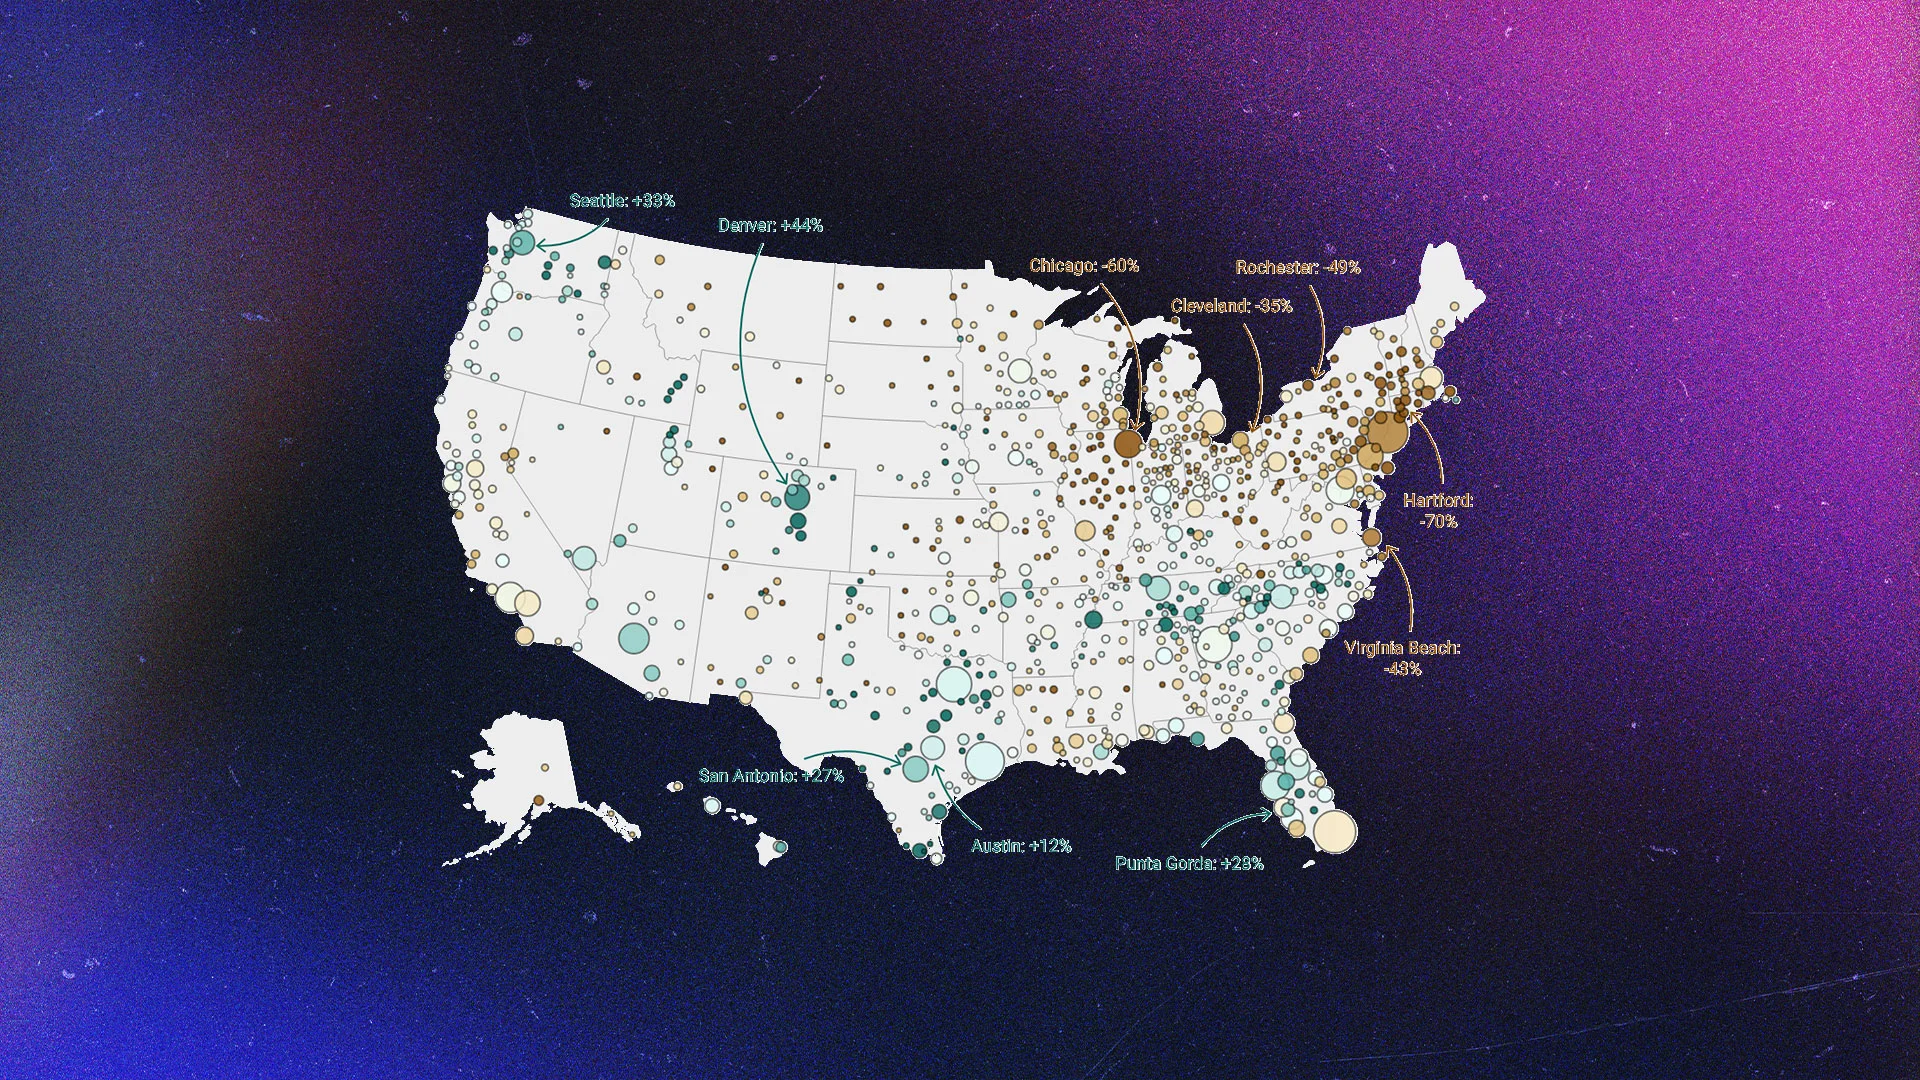
Fast-forward to the end of October 2026, and there were 1,183,520 active homes for sale (just -2.1% below pre-pandemic 2019 levels)—and now 105 of the nation’s 200 largest housing markets have more active inventory than they did in pre-pandemic October 2019.
Among the nation’s 200 largest housing markets, the table below shows the 105 markets where active housing inventory for sale at the end of October 2026 exceeded the levels those respective markets had in October 2019.
While this data cut (active inventory in a market compared to the same month in pre-pandemic 2019) will slowly become less useful over time, it remains useful right now.
One of the common pushbacks I hear when comparing today’s active inventory for sale to 2019 levels is that some markets—like Tampa and Colorado Springs—have larger populations now than they did back in 2019. It’s true that some of the markets with higher inventory today compared to 2019 are also the ones that have experienced notable population growth in recent years.
Source link