

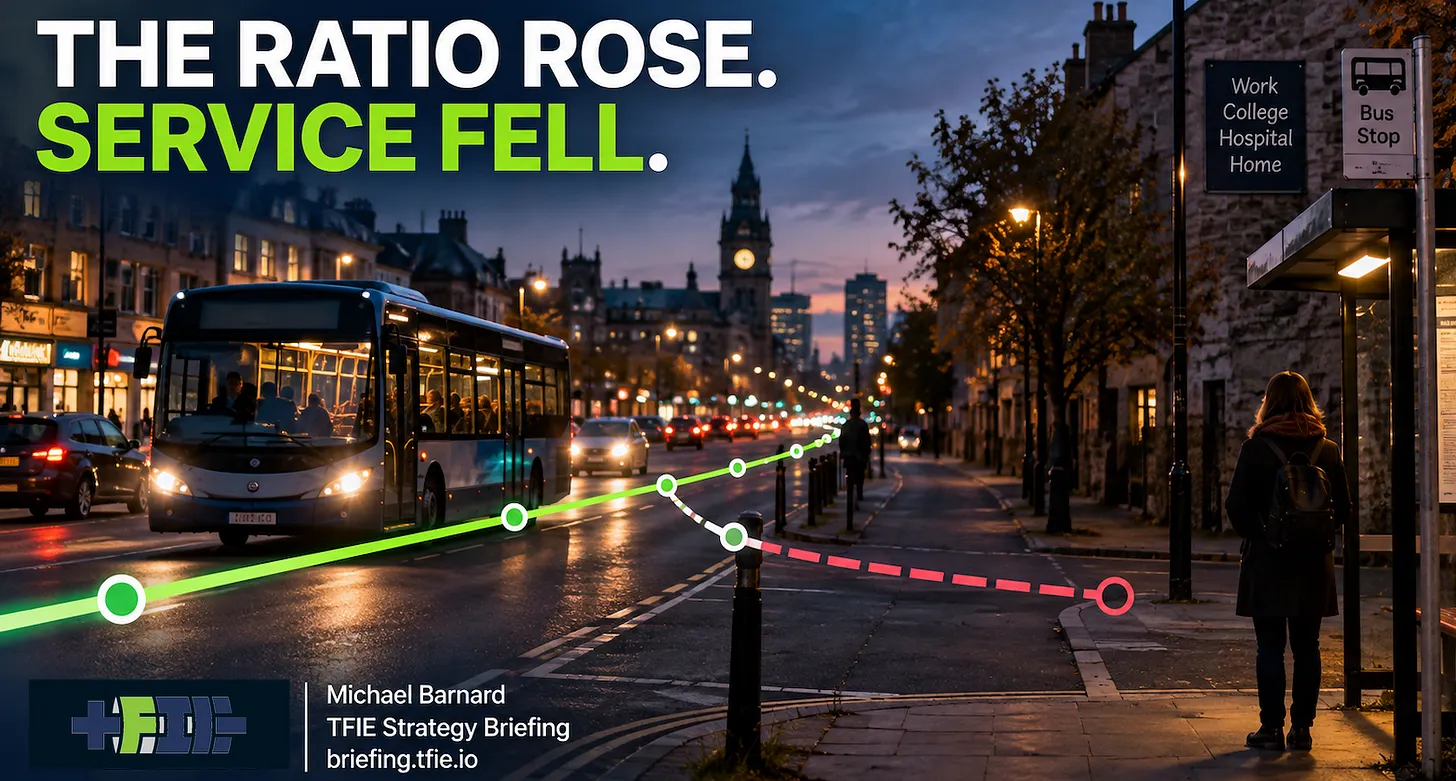
England outside London carried about 1.85 billion local-bus passenger journeys in 2024/25, compared with roughly 1.98 billion before COVID-19. Passenger journeys had recovered to 93.3% of their 2019/20 level, while bus service mileage had recovered to 86.0%. Put those two figures together and passenger journeys per service mile were about 8.5% higher than before the pandemic.
That is a legitimate productivity ratio. Operators have spent years adjusting schedules, controlling costs and concentrating resources where passengers are travelling. The difficulty comes when the ratio is treated as evidence that the passenger network itself has improved, because the underlying statistics cannot answer that question.
I examined the issue in How Can a Bus Network Become More “Productive” by Running Less Service?, the second article drawn from my broader The Bus Is Not the System report on what Britain and Ireland’s long experiment with bus governance can teach cities preparing to electrify their fleets.
The Department for Transport counts passenger journeys as boardings. Someone changing buses on the way to work will generally appear twice. Service mileage measures the distance travelled by buses providing local service, so dividing the two tells us how many boardings occur for each mile operated. It does not show how far passengers travel, whether important destinations remain reachable or whether the connections needed for complete journeys still exist.
Consider an evening service connecting a residential area with a hospital through a major interchange. It may carry relatively few people after the peak and be expensive for an operator to retain.
Source link