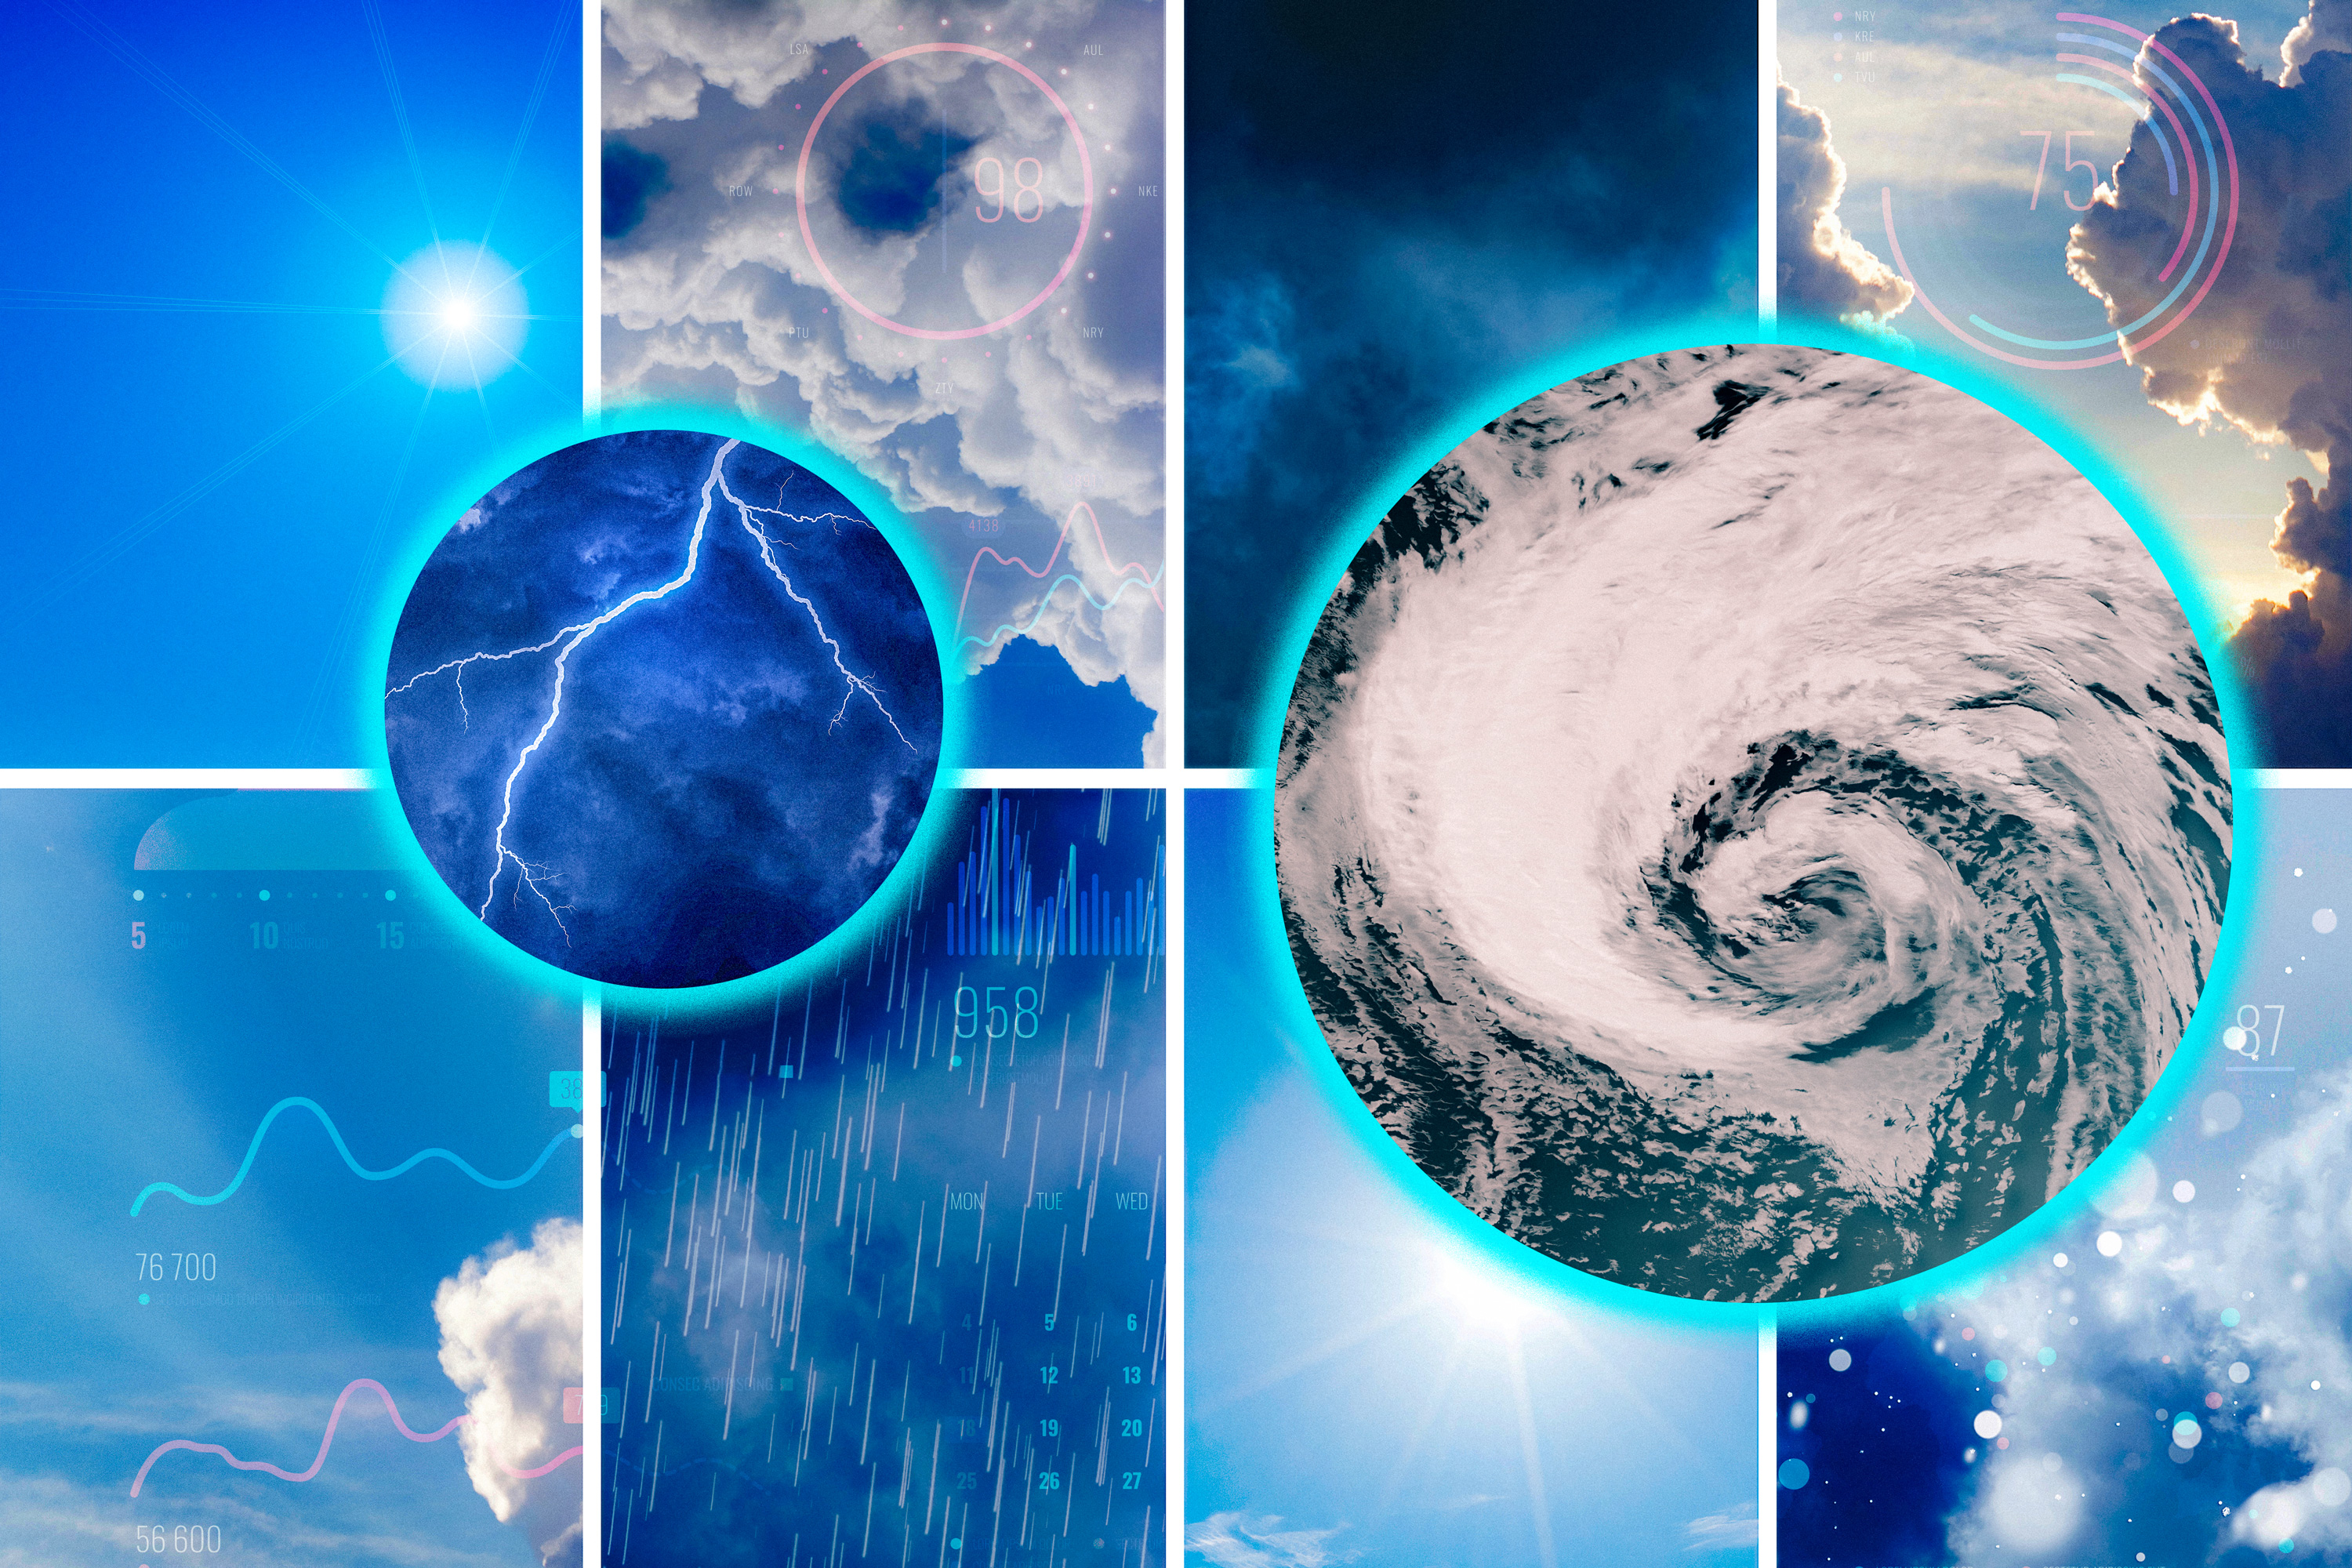
Can a city’s seawall stand up to a blockbuster storm? Will a region’s power grid hold against record-breaking heat? And can a town’s fire-fighting resources contain a major wildfire?
To answer these questions, communities will first need to know how such extreme events could unfold. How far is a wildfire likely to spread? How much of a region might a storm impact? How long could a heat wave last?
But extreme events are notoriously difficult to anticipate. By their nature, they are outliers. In the history of record keeping, extreme events are sporadic and rare. Yet most methods that assess a region’s risk depend on extreme events of the past to characterize even more extreme, worst-case scenarios in the future.
Now, MIT engineers have developed a tool that generates plausible extreme events and worst-case scenarios, and maps their characteristics, such as an extreme storm’s likely duration, intensity, and area of impact. The key to their method is that it does not need to know about previous extreme events in order to generate plausible future extreme events.
Instead, the method, in the form of a machine-learning algorithm, learns from a dataset, such as a region’s daily weather records and maps. This record may or may not contain past extreme deviations, such as record-setting heat or rain. The team’s algorithm takes a statistical approach to learn from the available data, to exclude implausible weather scenarios. The method then generates plausible extreme events that are likely to occur in a region with a given frequency (such as once every 100 years), and projects how those extreme events might look in terms of their size, intensity, and duration.
Source link